Administration Reports provide insights into your assessment and account data. Read below to learn more about these helpful reports!
- Period Settings Report
- Head Start Alignment Report
- Demographics Report
- Export Data
- Export Student Portfolios
- OSEP Reports
Period Settings Report
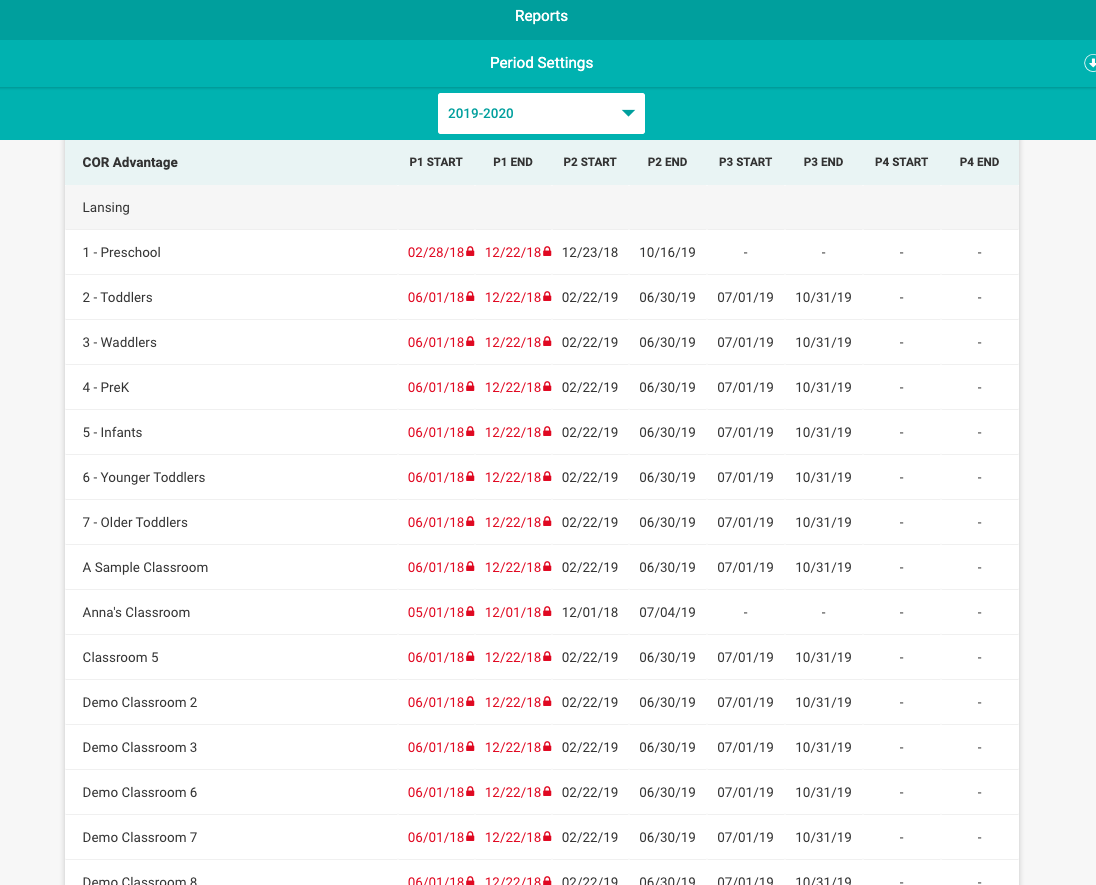
The Period Settings Report will display the assessment period settings for all entities in your account.
You can use the year filter at the top to toggle among your school years. Locked periods will be indicated by a red text and a lock icon.
Head Start Alignment Report
The Head Start Alignment Report will convert student performance from the COR Advantage assessment to the Head Start Early Learning Outcomes Framework (ELOF). You can learn more about Head Start alignments by clicking here.
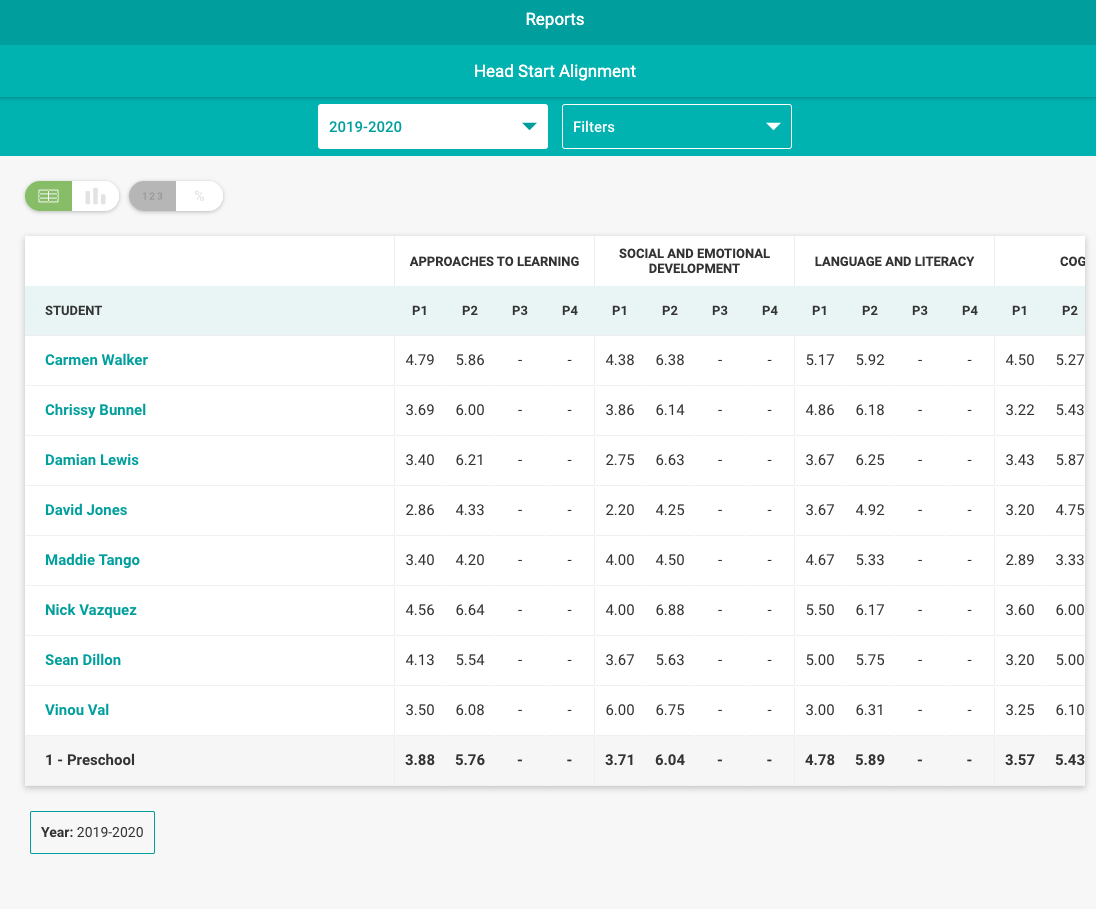
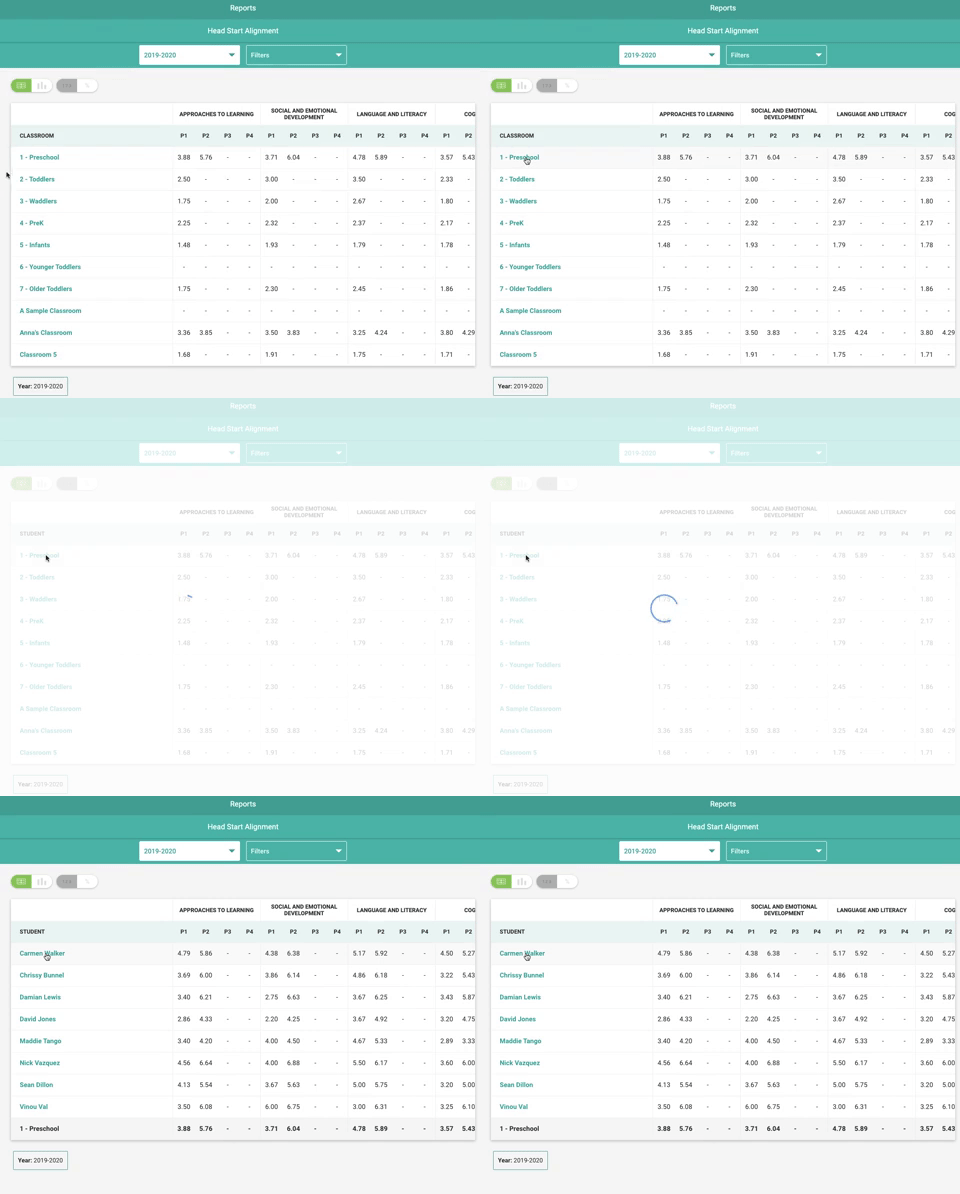
The column on the left displays the entity, while the top row displays the category and the periods. If you are looking at the report on an organizational or center level, the scores displayed are averages. Classroom levels will show you specific scores for each of the students. If you are an account manager, administrator, or a director, you can click into a specific entities to drill down further for more specific scores. You can also use the Filters at the top to sort and filter your report by specific demographic.
Demographics Report
The Demographics report shows student population statistics by demographic group.
The General and the Users sections display information regarding different parts of your account.
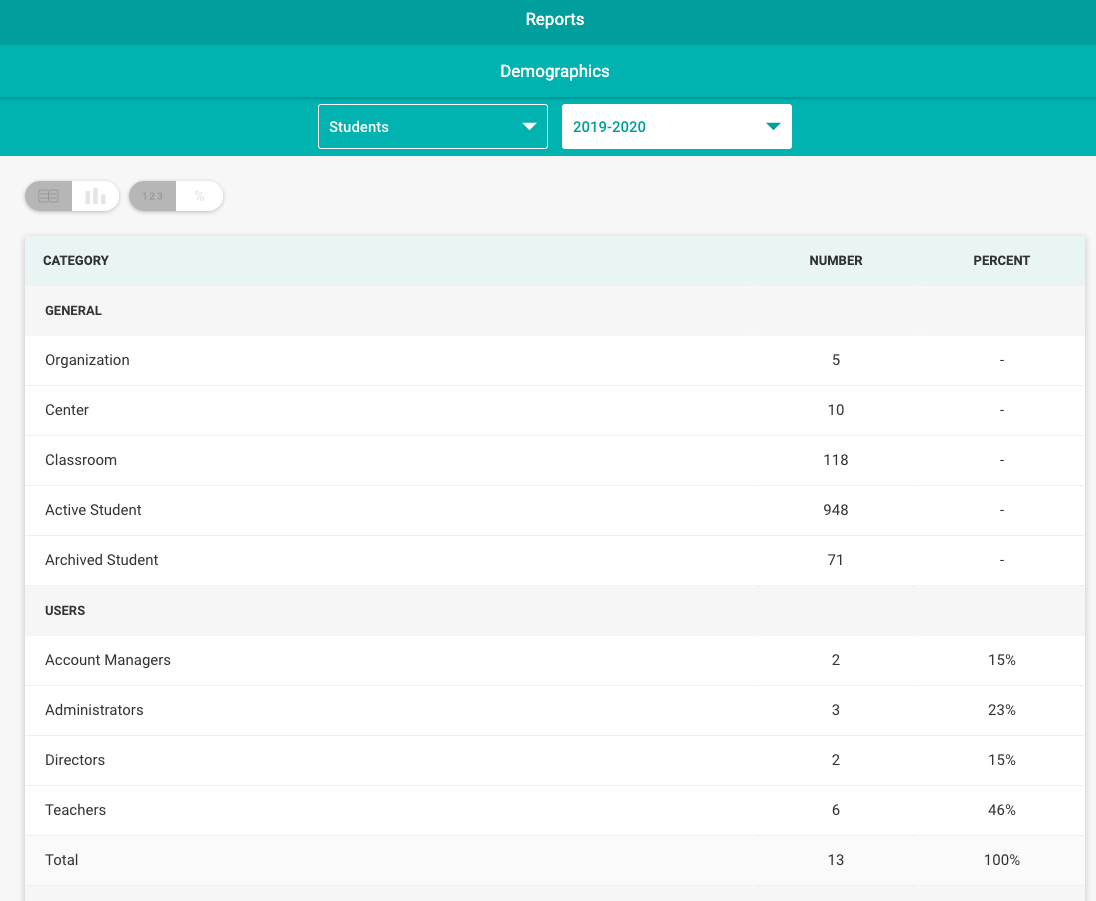
The following sections will breakdown the number and percentages of students you have for each of the demographic category.
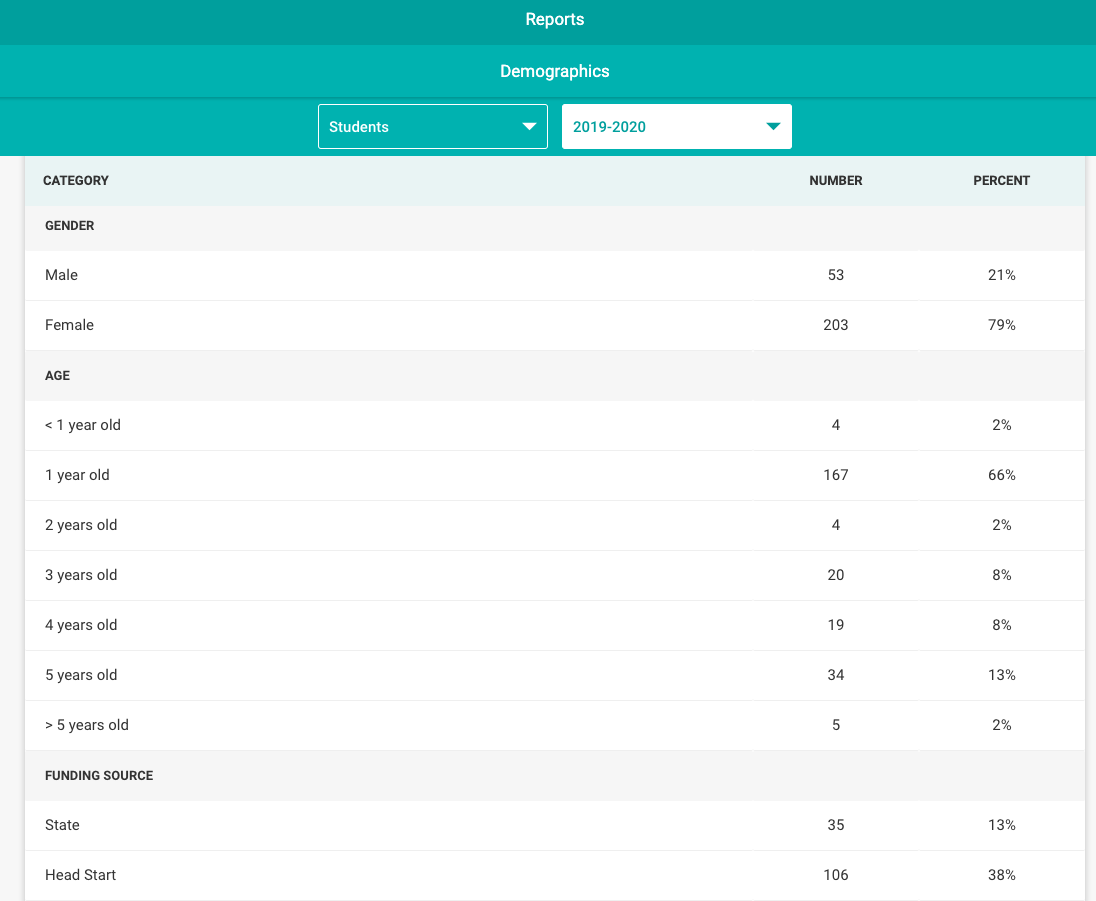
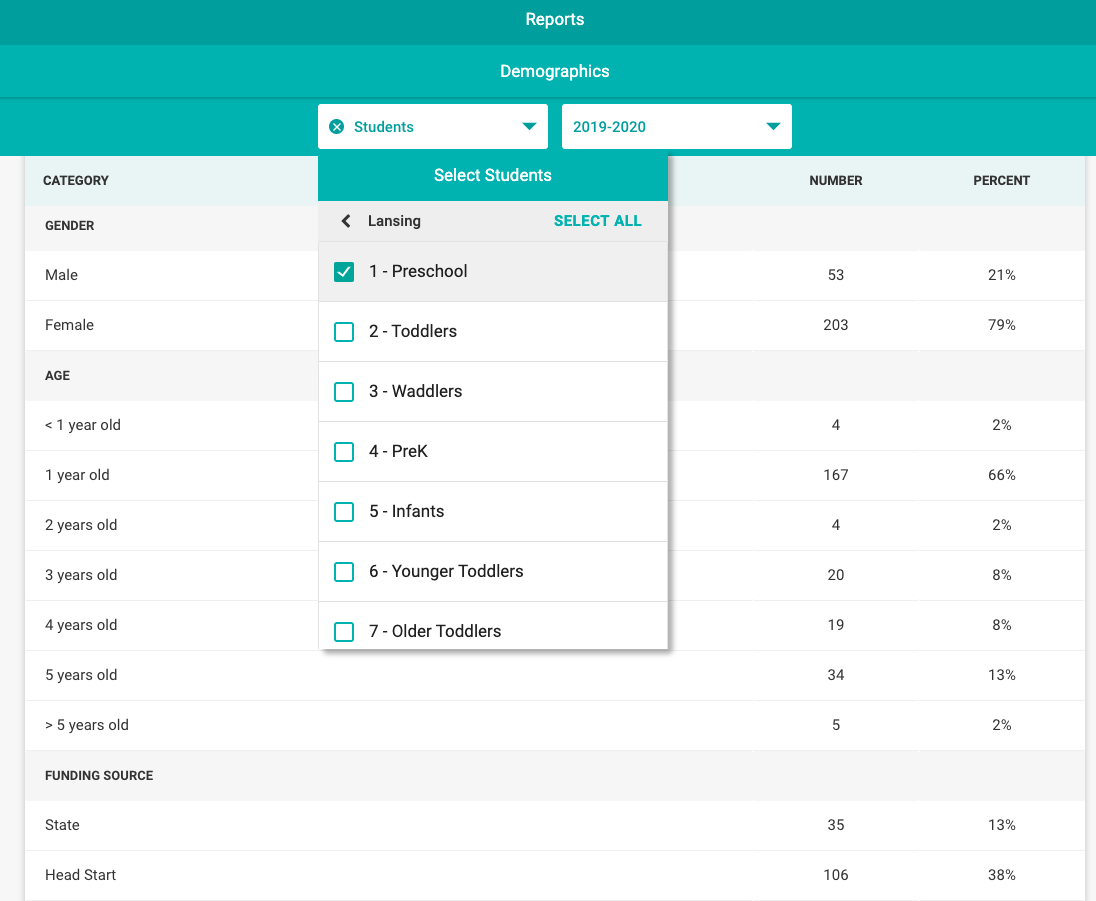
By using the Students filter at the top, you can filter the report down to specific sites and classrooms. If your account allows, you can also select to view the Demographic report from the previous year using the year filter as well!
Export Data
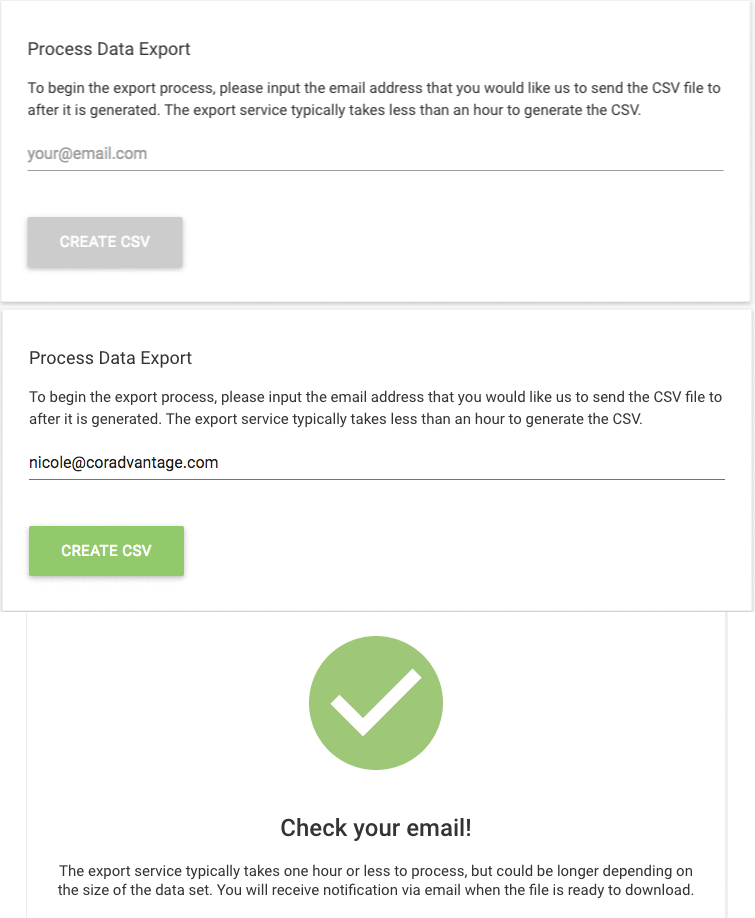
Exporting all of your data is extremely easy within the COR Advantage system! Simply go to Reports > Administration > Export Data, enter your email address, and click Create CSV. Within an hour, you should receive an email with a link to download all of your data.
What information is included?
Every piece of data, including student demographic information, is included in the Data Export. When you download the data, columns A-Z include all of the account and demographic information, and columns AA-FN include the highest score for each item and period. Each child within your account will have their own row of data.
Can Administrators and Teachers see the exact same information?
No, the information you see is limited to the students you have access to within COR Advantage. Teachers would only see the information for the students in their classroom, while Account Managers, Administrators, and Directors would see the information for all students within their account, organization, or center.
Do I need to export my data each period?
It is not necessary to export your data each period, as COR Advantage allows unlimited data storage. That being said, many programs do choose to export their data each period to store outside the system. The choice is yours to make!
Export Student Portfolios
Use the Export Student Portfolios Report to export and print or download multiple Student Portfolios at once!
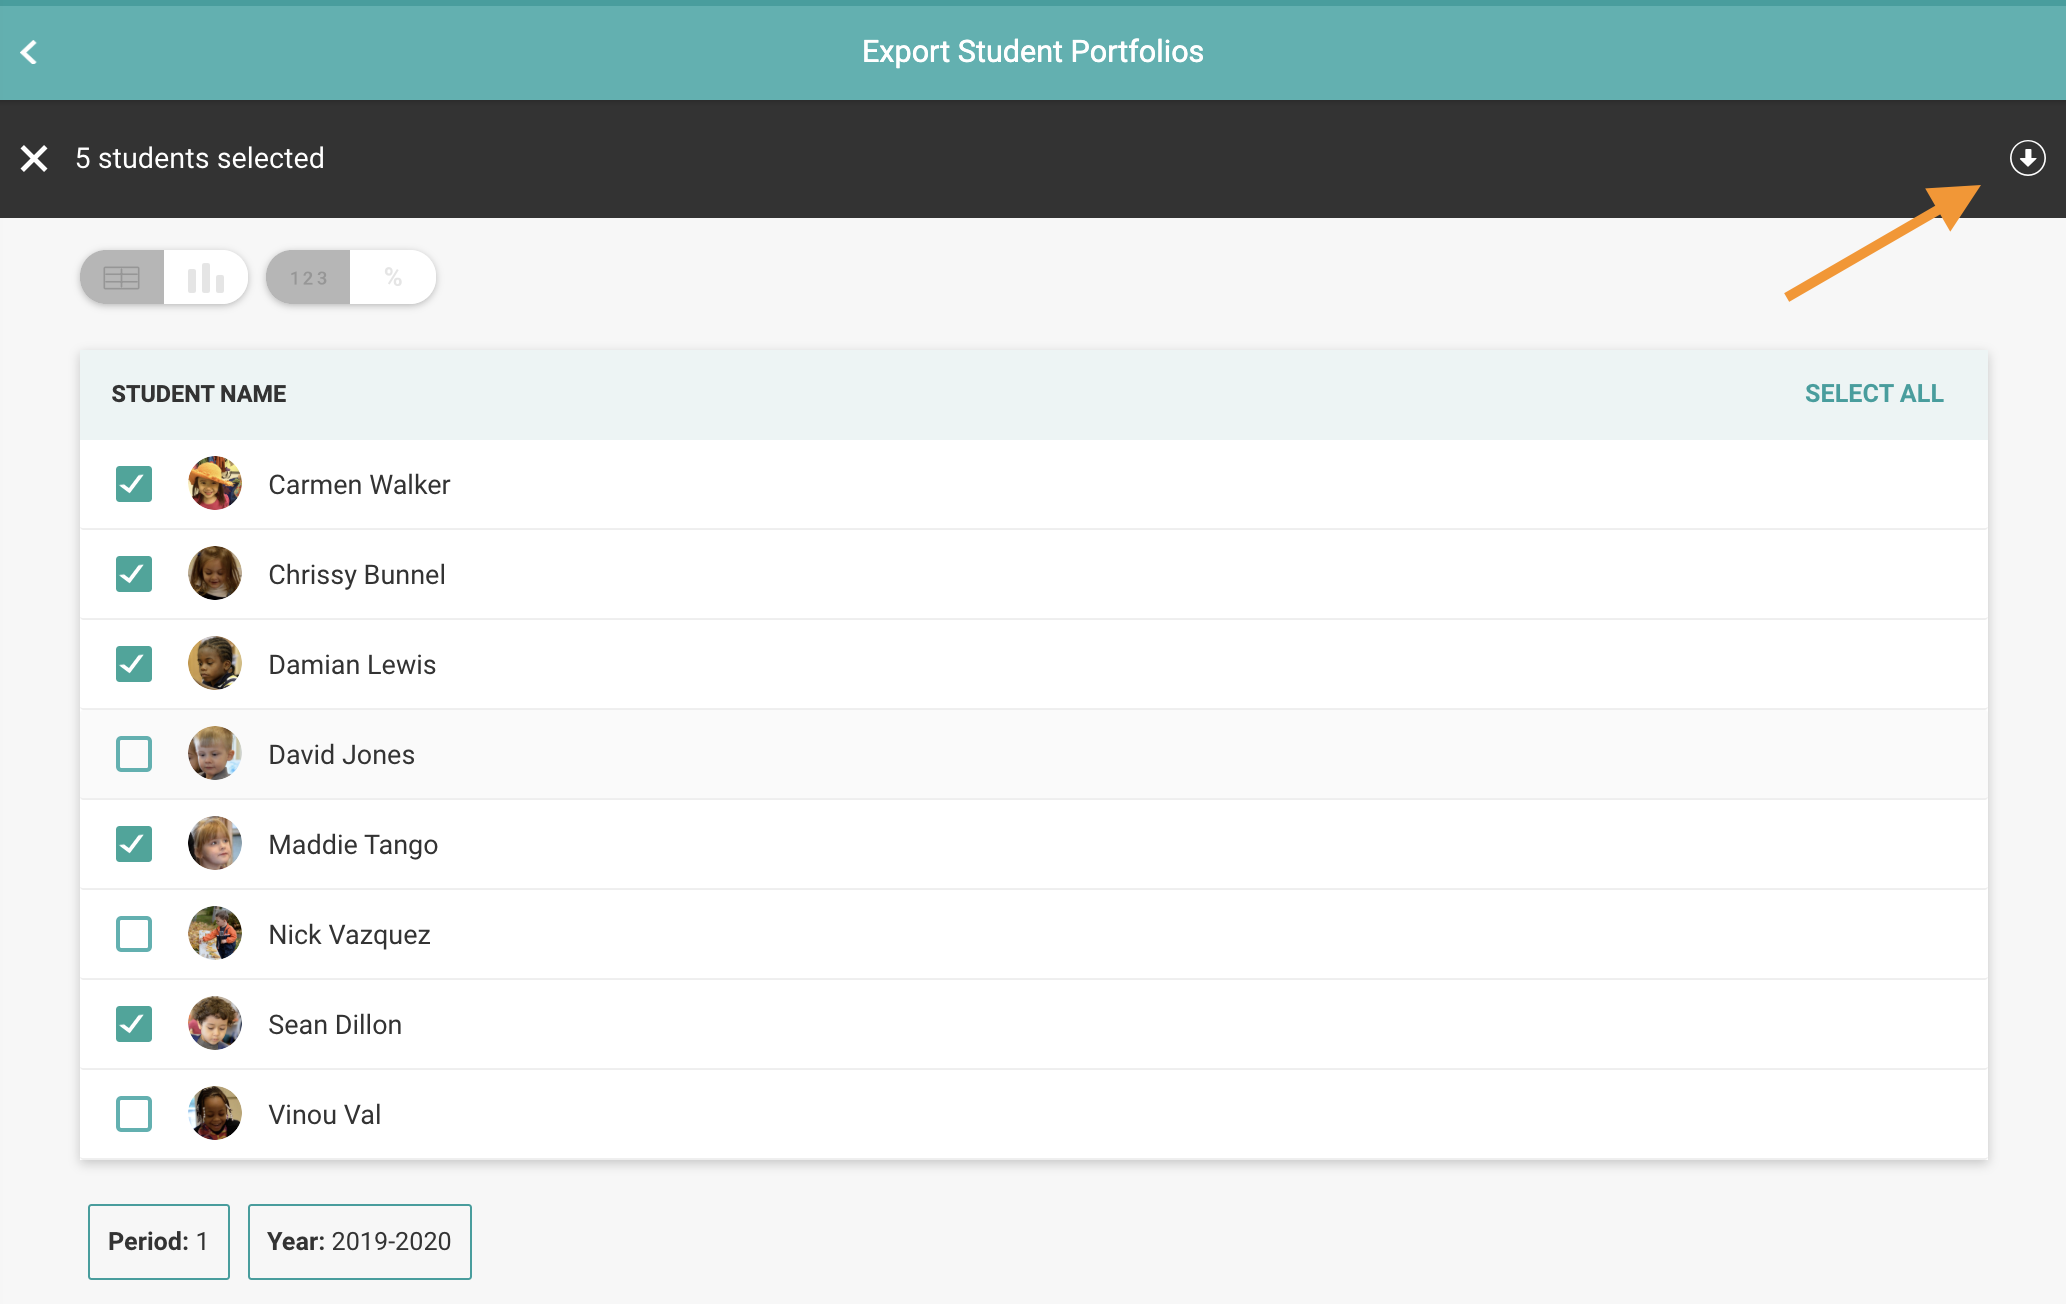
Navigate to Reports > Administration > Export Student Portfolios and you will see the students whose portfolios you can export. You can use the filters at the top of the page to select a specific period or year.
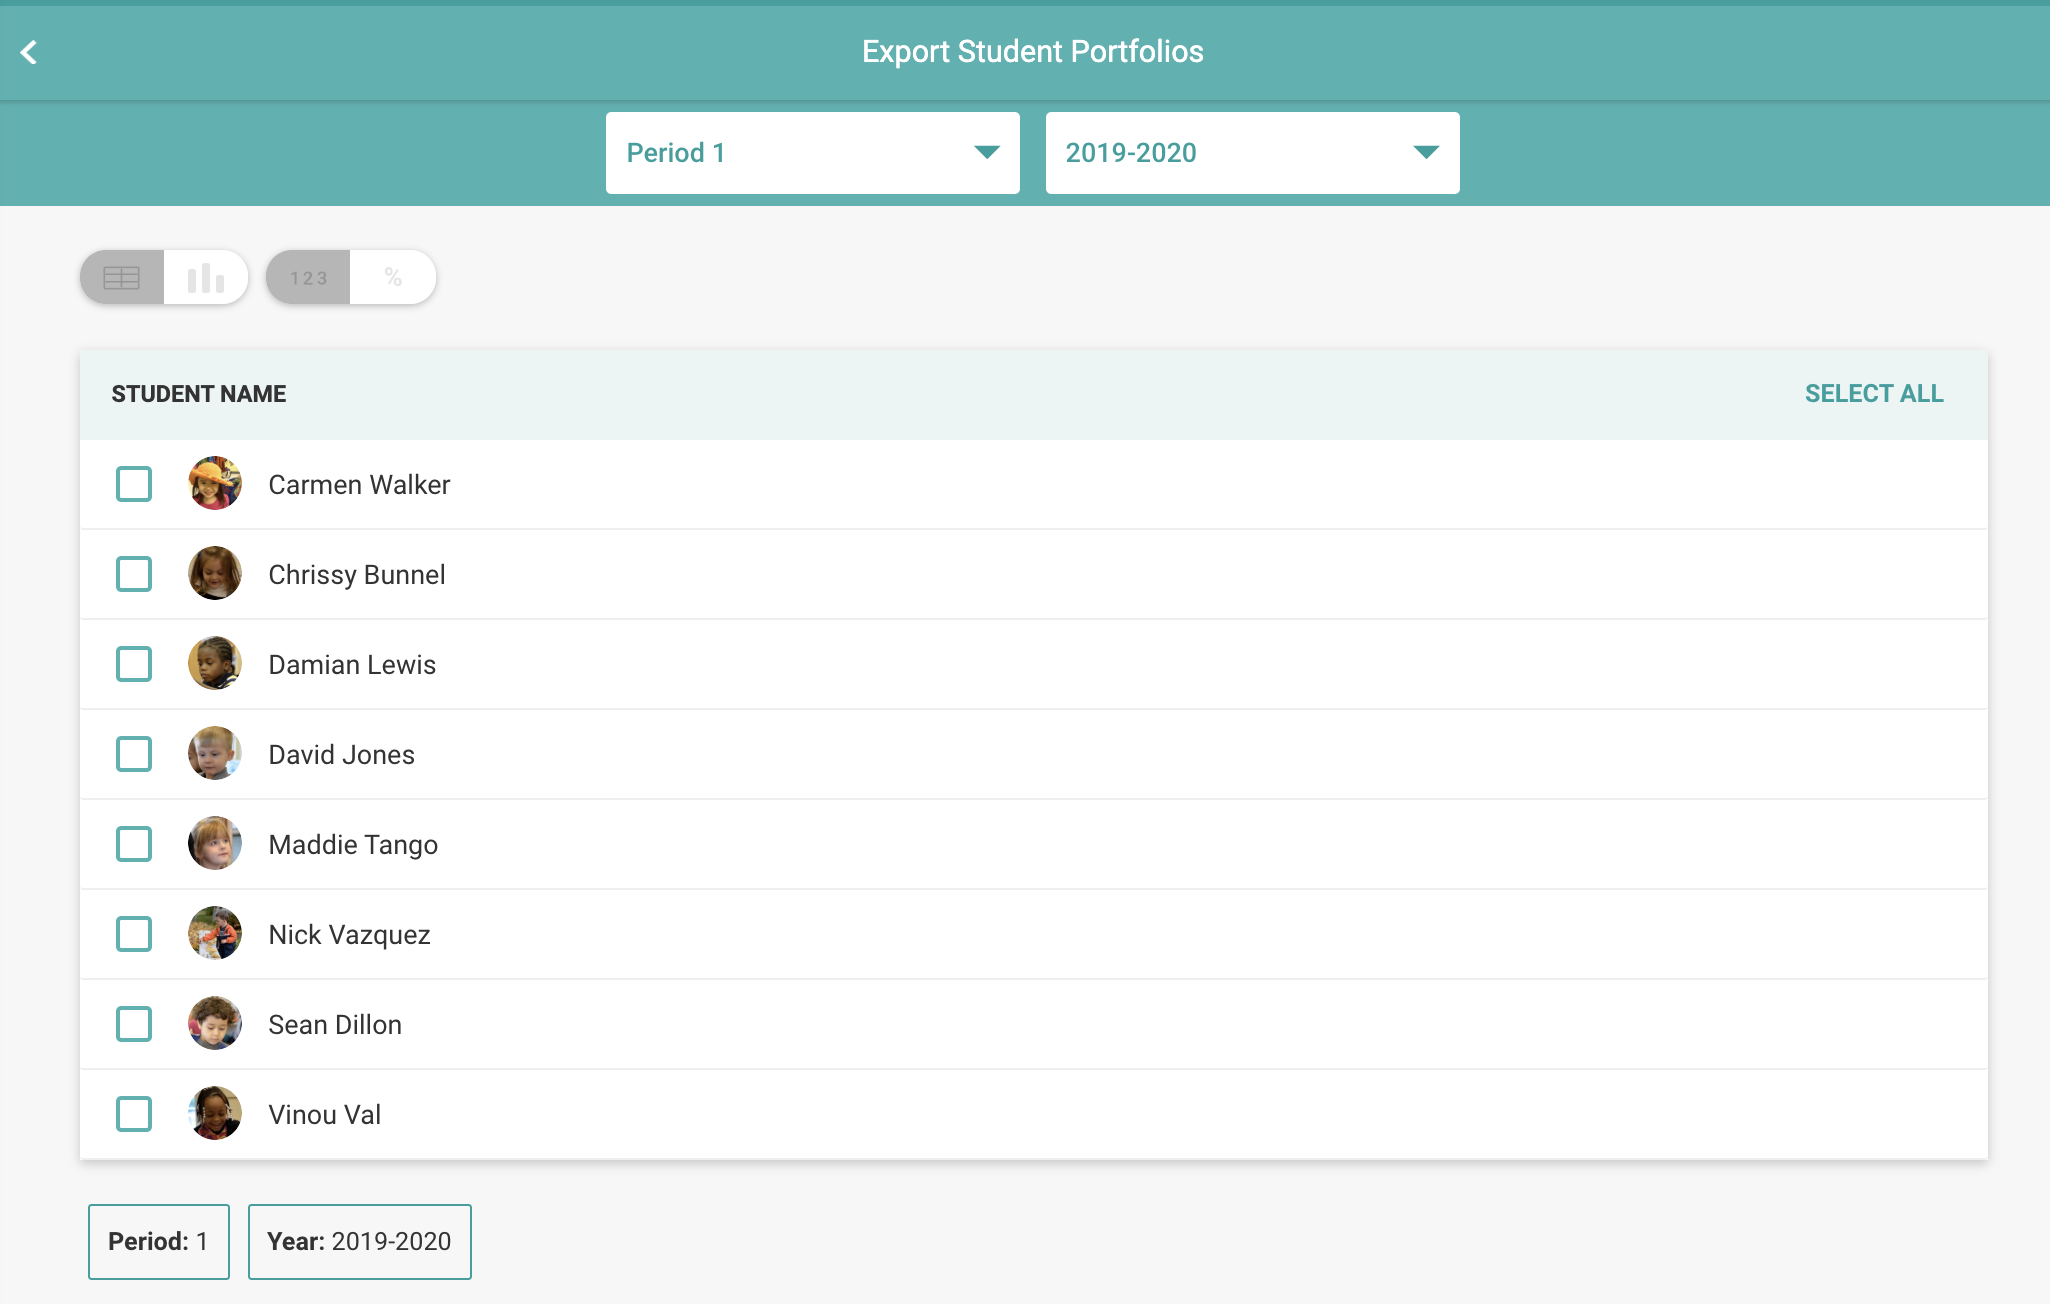
Select student(s) by clicking the box next to the student's icon, or click the "Select All" button on the right-hand side. Once you've selected one or more students, a black bar will appear at the top of the screen. Click the arrow to begin the export.
You'll be prompted to select whether you want to export the Family Report, or Student Portfolio, or the Student One-Pager.
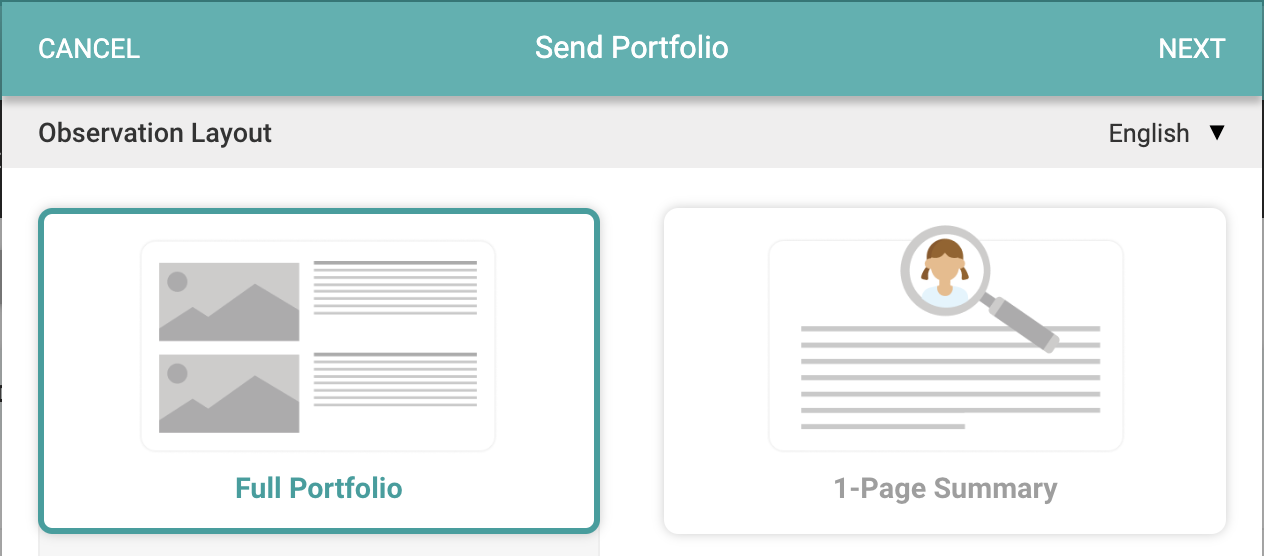
Once you've made your selection, click "Next" and enter an email address where the generated reports should be sent.
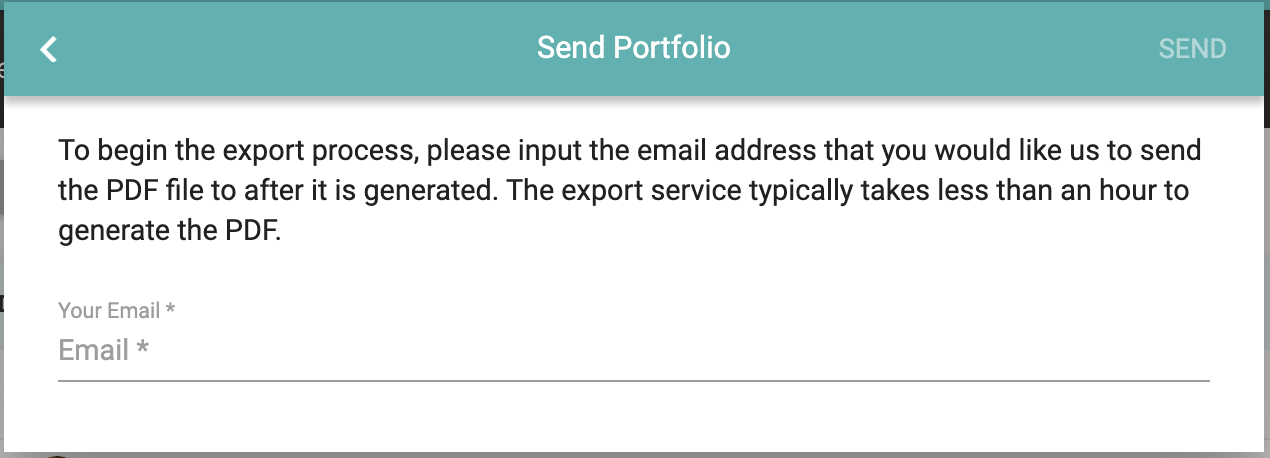
Within the hour, you'll receive an email with a zip file of the reports you've selected!
OSEP Reports
OSEP is the Office of Special Education Programs, a part of the Individuals with Disabilities Education Act (IDEA), which provides funding for Students with Special Needs. Students who receive funding through Part B or Part C of IDEA for more than six months must have their progress reported to OSEP. You can learn more about OSEP here.
OSEP separates age groups into two parts: Part B and Part C. Part C includes children from Birth to 2 and Part B includes children age 3 to 21.
There are three COR Advantage-aligned Child Outcomes that make up OSEP scores:
- Positive social-emotional skills (including social relationships);
- Acquisition and use of knowledge and skills (including early language/communication [and early literacy]); and
- Use of appropriate behaviors to meet their needs.
You can learn more about Child Outcomes here.
Any time COR Advantage is used to score an observation for a student who has started or stopped receiving special education services within the last 45 days, it is factored into the student’s OSEP Entry Report or Outcomes Report.
As the Director or Administrator, it is important to be familiar with OSEP and how teachers enter data, and also how to use and submit the OSEP Outcomes Report.
How do I include a student in the OSEP Reports?
The first step to including a student in the OSEP Reports is to add an IEP or an IFSP on the student’s profile and indicated whether he or she has Part B or Part C funding. To add this designation, navigate to Menu > Roster, then click on the child’s name. Then click the pencil icon, which allows you to “Edit Student,” near the child’s profile picture.
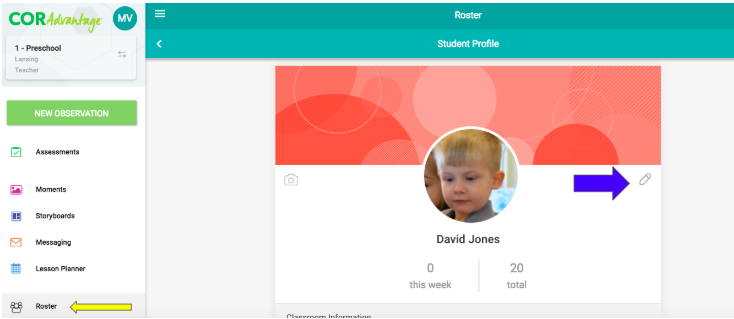
You will also have this option when you create a student profile for the first time. Click save after making these changes to the student’s profile.
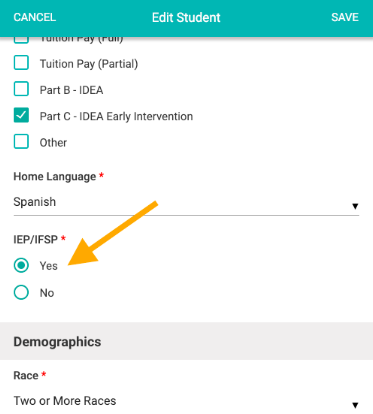
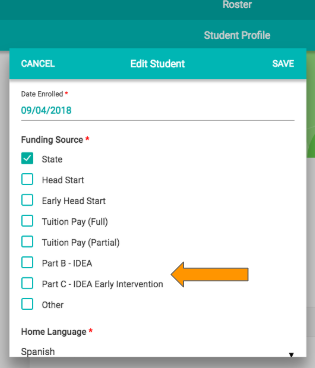
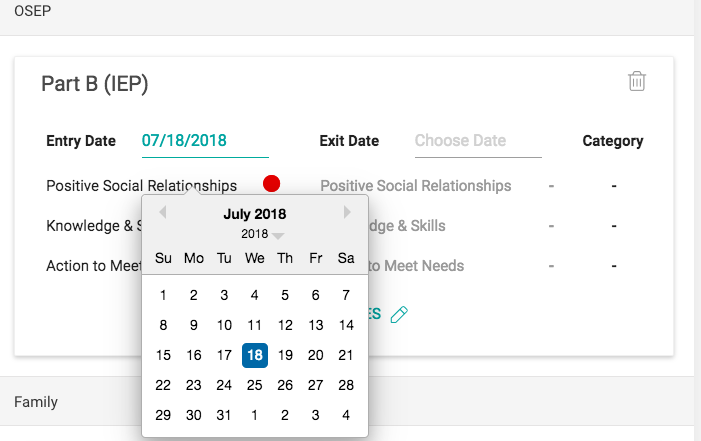
Once you save those changes, an OSEP section will appear on the student’s profile. To finish the student’s OSEP setup, you will need to enter the “Entry Date,” in the OSEP section of the student’s profile.
What is the OSEP Entry Report?
The OSEP - Entry Report is an assessment of the student’s development upon program entry.
You can find this by navigating to Menu > Reports > OSEP - Entry Report.
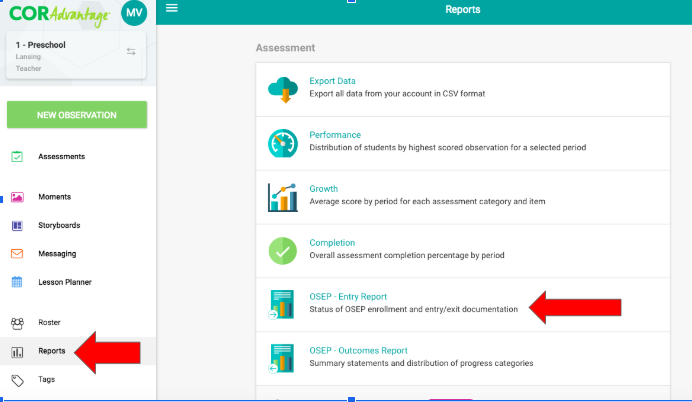
This holds information that OSEP needs in conjunction with the Outcomes Report to calculate each student’s progress.
Use the OSEP Entry Report to track Part B and Part C enrollment, as well as the completion status of entry and exit scores. Teachers will be able to track enrollment and documentation status for their classroom, while administrators will be able to see their whole site or program, depending on their permissions.
How do I enter Scores in the OSEP Entry Report?
When teachers enter COR Advantage items, their associated scores will automatically populate a student’s OSEP Entry Report.
The report will include items and scores entered during the 45 day period before and after their entry in OSEP.
Note: this time window does not correlate to your COR Advantage assessment periods. It is a collection period specifically designed for OSEP reporting.
You can also enter OSEP scores on the Entry Report by clicking on Edit Scores.
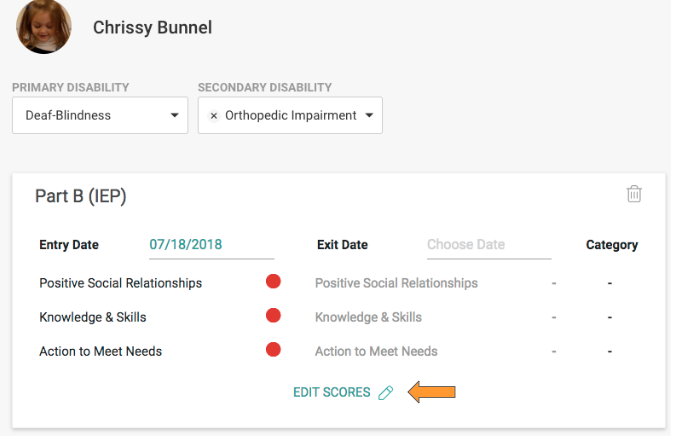
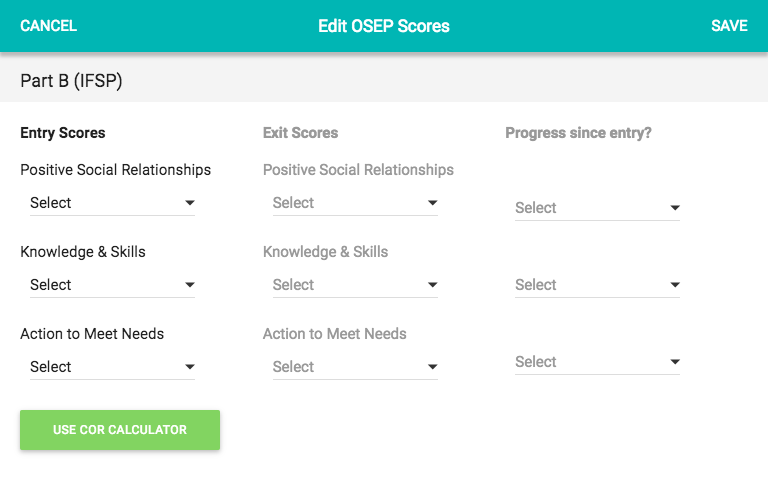
Once you click in to “Edit Scores,” you will notice there are two ways to manually enter them: You can directly edit the OSEP scores, or use the COR Advantage calculator. If you already know the scores for the three outcomes for a child -- for example, if these scores were calculated using a different assessment and you’re transferring the data to COR Advantage -- edit the COR Advantage scores directly by using the 1-7 scale.
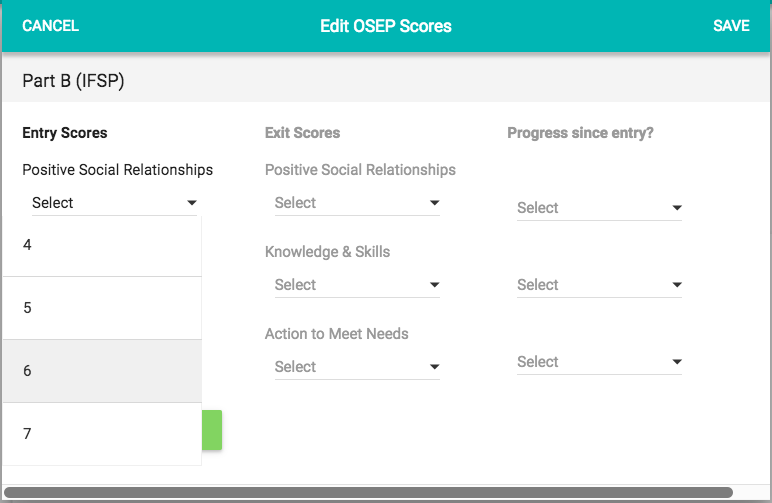
Otherwise, we recommend that teachers use the COR Advantage calculator to translate the COR Advantage rubric to OSEP scores. Manually entering scores using either of these methods will only affect a child’s OSEP scores, and will not alter any other assessment data.
Entering Scores through the COR calculator:
When in the Entry Report, If you see a red circle, this means the report is incomplete. If it is green, it’s ready to go!
What is the OSEP Outcomes Report?
The OSEP - Outcomes Report collects the exit data that will ultimately be exported as an Exit Score, most likely by program administrators.
The collective data is calculated into a Summary that places the student into one of the Categories (A, B, C, D, E).
After you have entered the Outcomes Report, you will see all of your students and their scores under their associated Child Outcomes (1-3). Then you will notice a drop down menu in which you can select which Part, B or C, you need to view. To the right of that, you will see another drop down menu where you can select to see any students in the Outcomes Report or students who have been receiving funding for more than six months.
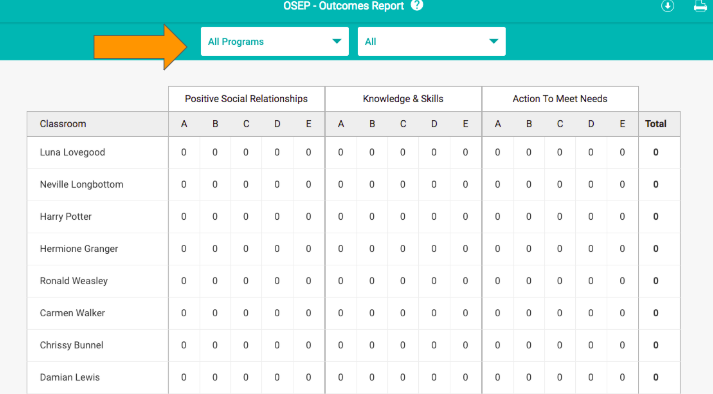
Once you are ready to send a completed Report, navigate to Reports > Outcomes Report > Download icon.

When the Report is complete and downloaded, it is ready to go!
Comments
0 comments
Please sign in to leave a comment.