Head Start Alignment Report
The Head Start Alignment Report converts student performance from the COR Advantage assessment to the Head Start Early Learning Outcomes Framework (ELOF). The COR Advantage items are aligned to the five ELOF categories: Approaches to Learning, Social and Emotional Development, Language and Literacy, Cognition, and Perceptual, Motor, and Physical Development. The scores in the Head Start Alignment Report reflect the average of the COR Advantage item scores that are aligned to the respective category.
Table of Contents
- Accessing Head Start Alignment Report
- Calculating Head Start Alignment Report
- Viewing Head Start Alignment Report
Accessing Head Start Alignment Report
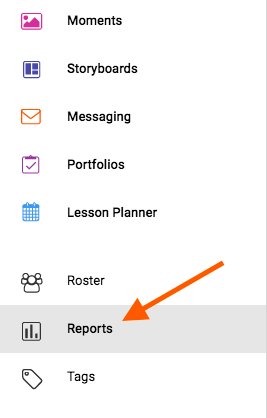
The Head Start Alignment Report is accessible for users with the COR Advantage assessment from the website my.kaymbu.com by going to Menu > Reports > Administration > Head Start Alignment. Please note, access to this from a device is dependent on the size and orientation of your screen. Your device must have at least 768 pixels and may need to be in landscape mode in order to access the report.
Calculating Head Start Alignment Report
The scores in the Head Start Alignment Report specifically reflect the COR Advantage 0-7 rating scale for each of the categories, but the scores in each category are based on the relevant items from the Head Start Early Learning Outcomes Framework. You can learn more about Head Start alignments by clicking here.
Viewing Head Start Alignment Report
The column on the left of the report displays the entity, while the top row displays the category and the periods. If you are looking at the report on an organizational or center level, the scores displayed are averages. Classroom levels will show you specific scores for each of the students. If you are an account manager, administrator, or director, you can click into a specific entity to drill down further for more specific scores. Additionally, you can use the filters at the top to sort and filter your report by student fields or data sets or chose to view your data in a table or bar graph.
In the top right corner of this report, you will see download and print icons. You can select either of those to export the information currently displayed on the screen.
Comments
0 comments
Please sign in to leave a comment.