Overview of Demographics Report
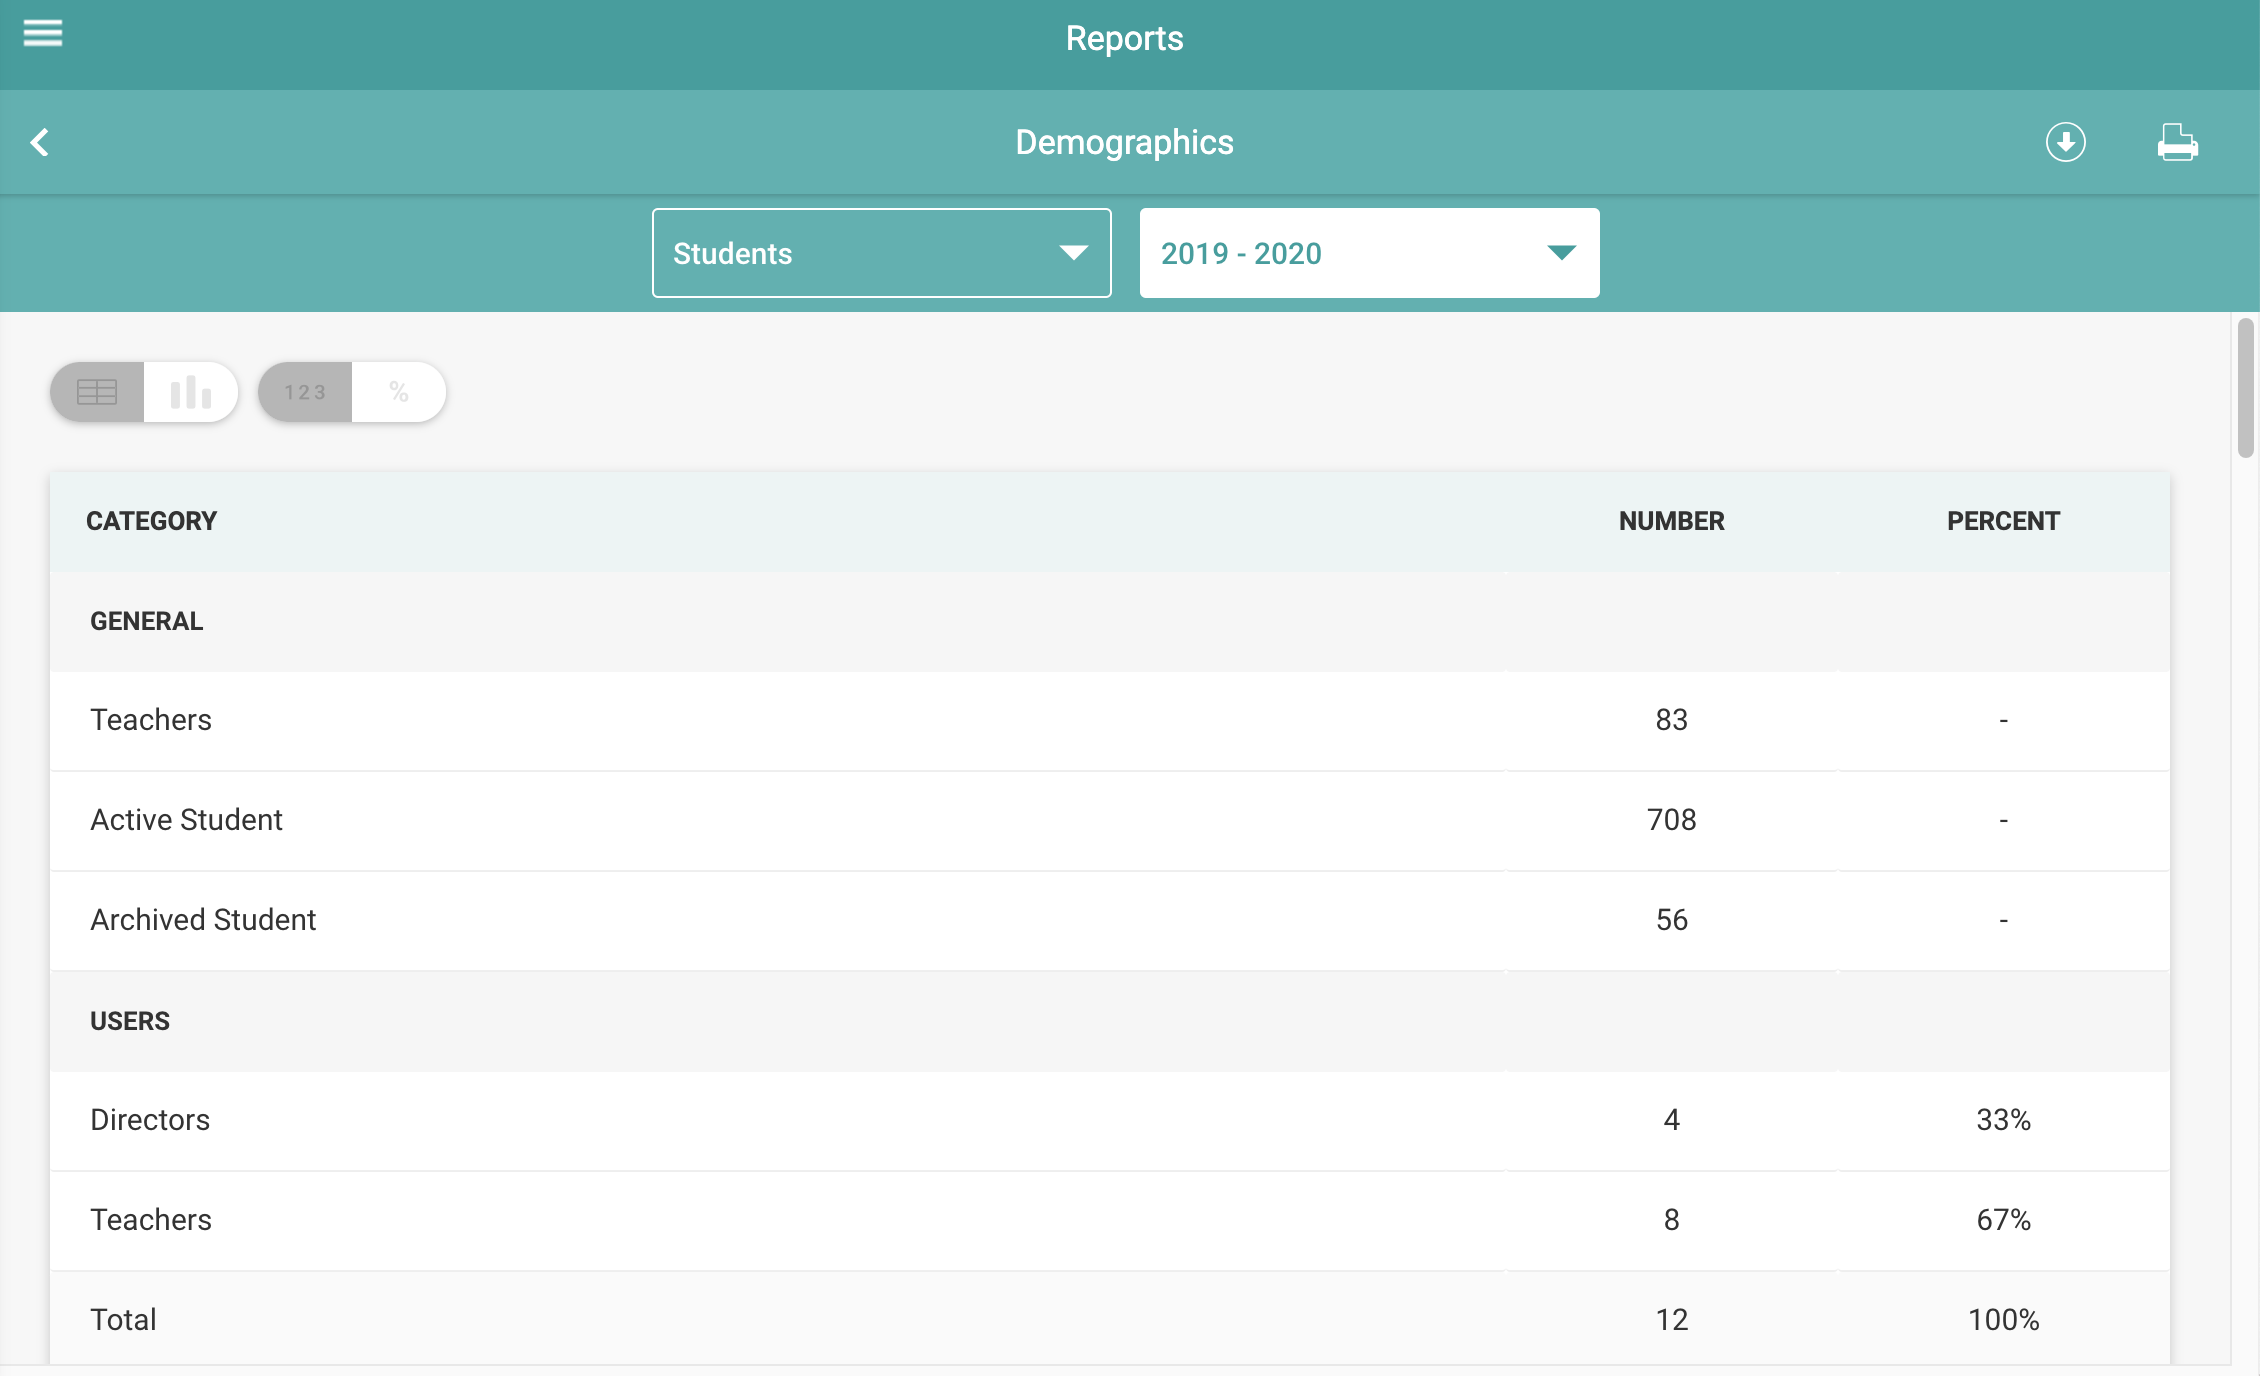
The Demographics Report shows student population statistics by demographic group. The General and Users categories count the number of teachers, students, and users in the account. The remaining sections break down the number and percentages of students by various demographic groups. The report can be used to provide you an overview of the demographics of your students.
Table of Contents
Accessing Demographics Report
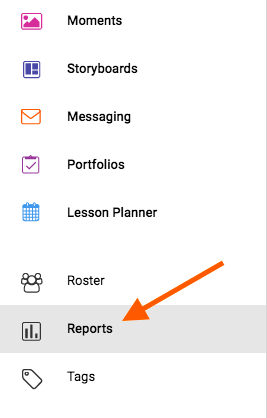
The Demographics Report is accessible for users with the COR Advantage assessment from the website my.kaymbu.com by going to Menu > Reports > Administration > Demographics. Please note, access to this from a device is dependent on the size and orientation of your screen. Your device must have at least 768 pixels and may need to be in landscape mode in order to access the report.

Calculating Demographics Report
The data from the Demographics Report is pulled from the student fields of the active students on your Roster of the day you generate the report. Any students that are archived will not count towards the total numbers or percentages.
Viewing Demographics Report
The General and the Users sections display information regarding different parts of your account.

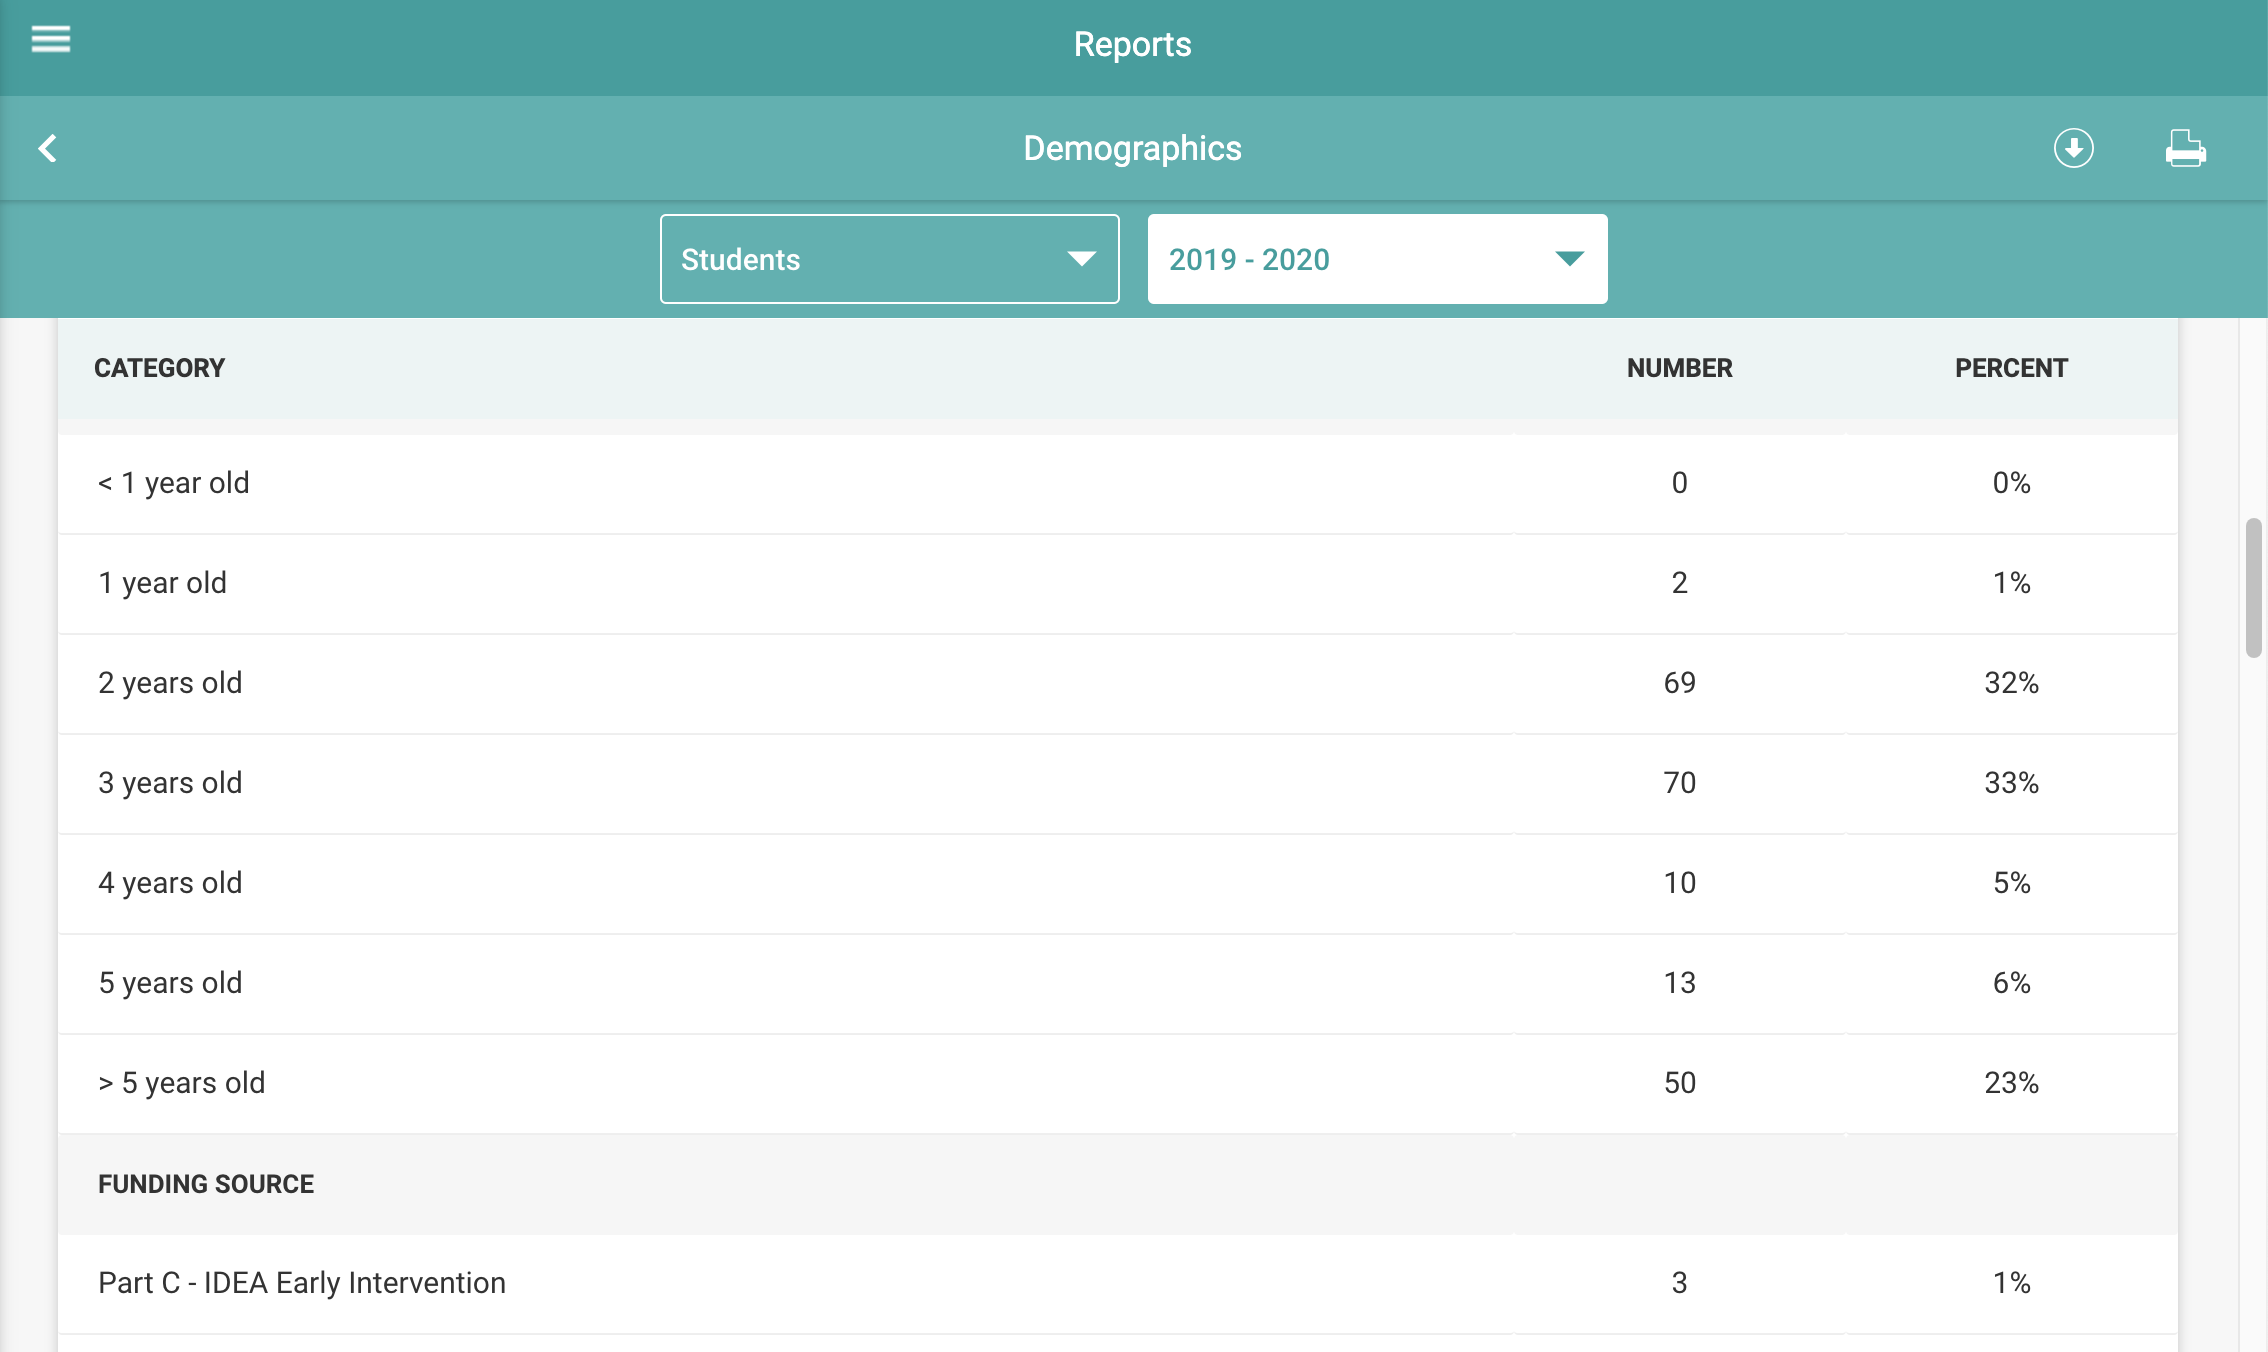
The following sections break down the total number and percentages of students you have for each of the demographic categories, including gender, age, funding source, home language, IEP/IFSP status, race, ethnicity, family structure, and free & reduced lunch.

By using the Students filter at the top, you can filter the report down to specific centers and classrooms. You can also select to view the Demographic Report from the previous year using the year filter. In the top right corner of this report, you will see download and print icons. You can select either of those to export the information currently displayed on the screen.
Comments
0 comments
Please sign in to leave a comment.