Overview of Performance Report
The Performance Report shows the distribution of students for each item. For teachers, this report can help you answer questions such as where is my class generally, and what skills should I support students to develop next? While administrators could also answer these same questions with the Performance Report, they may also need to answer questions about how certain children or groups of children are performing. For example, perhaps an administrator needs to know how 3-year-old students with special needs or students with particular funding sources are doing. Administrators can use the filters on the Performance Report to look at a particular subset of students. The Performance Report enables you to gain clarity around where your students are currently successful and where there’s space to grow.
Table of Contents
Accessing Performance Report
The Performance Report is accessible for users with the COR Advantage assessment from the website my.kaymbu.com by going to Menu > Reports > Growth and Planning > Performance. Please note, access to this from a device is dependent on the size and orientation of your screen. Your device must have at least 768 pixels and may need to be in landscape mode in order to access the report.
Overview of Performance Report
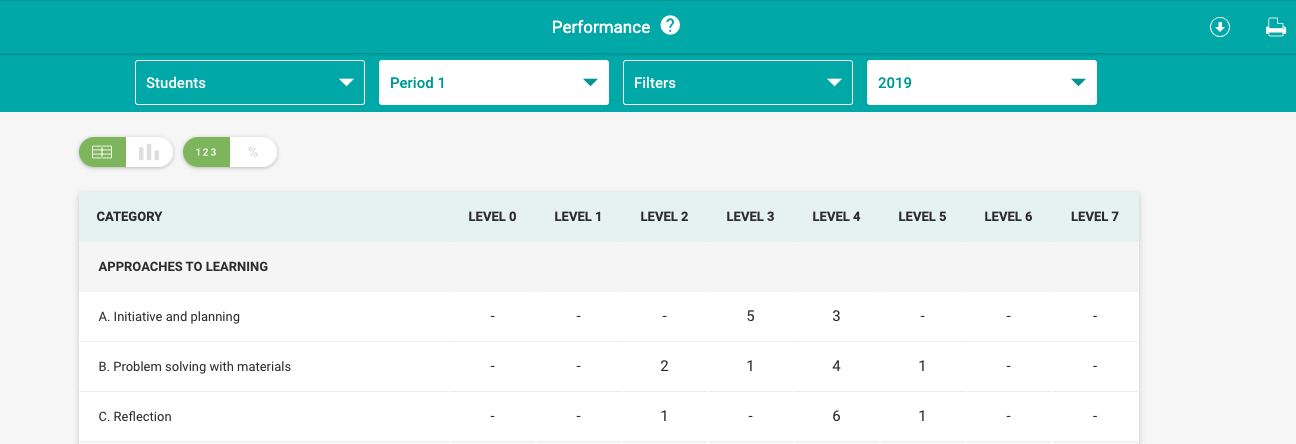
The Performance Report shows the total number of students who have been observed with the designated score for each COR Advantage assessment item. The values in the table represent the number of students whose highest scored anecdote during the specified period is at the specified level.
At first glance, the report will show you the number of students that fall under each level for each item (based on their highest score). You can also choose to use the percentage toggle at the top of the page as it translates the number of students into percentages.
Viewing Performance Report
By default, you will see the data for all students you have access to within your account. If you would like to view a subset of students, you can use the "Students" "Period" "Filters" and/or "Year" options at the top of the screen to find the specific data you would like.
- Students: You have the ability to select a specific group of students, whether it be an organization, center, or classroom, click the box to the left of the entity name. If you click on the arrow to the right of the entity name, you will be able to make a selection from the next level, all the way to the classroom level. Please note it is possible to select whichever combination of groups you would like.
- Periods: Using the Period filter will allow you to see your data for the different assessment periods of your school year. Select the drop-down and toggle between the Periods to change your data.
- Filters: In addition to viewing data for specific students or groups of students, you can choose to filter the data based on the demographic fields attached to your student profiles. Like viewing for students, it is possible to select whichever combination of demographic filters you would like. You can also choose to view the data with Matched Data Sets.
- Year: The Year filter allows you to see your data from previous school years. Select the drop-down and toggle between the years to change your data.
In the top right corner of this report, you will see download and print icons. You can select either of those to export the information currently displayed on the screen.
Comments
0 comments
Article is closed for comments.