Overview of Benchmarks Report
The Benchmarks Report is designed for educators to identify how student performance compares to national averages for each of the COR Advantage categories. As an administrator or teacher, this report can help answer the question, based on the ages of my students, how are they doing compared to national averages on the COR Advantage assessment. This report indicates if student performance is performing at above age-level norms or the top 25%, consistent with age-level norms or in the middle 50%, or if the student is performing below age-level norms or at the bottom 25%.
Table of Contents
Accessing Benchmarks Report
The Benchmarks Report is accessible for users with the COR Advantage assessment from the website my.kaymbu.com by going to Menu > Reports > Growth and Planning > Benchmarks. Please note, access to this from a device is dependent on the size and orientation of your screen. Your device must have at least 768 pixels and may need to be in landscape mode in order to access the report.

Calculations of the Benchmarks Report
The Benchmark Report reflects student performance compared to peers within the same 3-month age window. The report is grouped into Above, Meeting, and Below, which reflect the following groups relative to the national averages:
- Above = performing above age-level norms (top 25%)
- Meeting = performing consistent with age-level norms (middle 50%)
- Below = performing below age-level norms (bottom 25%)
The data which sets the above, meeting, and below groups comes from students assessed using the digital version of COR Advantage for the 2013-14 school year, totaling 49,692 children from 3,994 classrooms. As not every child was rated for all assessment items or periods, the actual sample sizes varied approximately between 27,000 and 35,000 for Period 1; 33,000 and 40,000 for Period 2; and 29,900 and 35,000 for Period 3.
Factors to Consider
In the Kaymbu System, each of your students’ highest scores for each item per category is converted into scores that are used to make the Benchmark comparisons. Because each student’s scores are compared to where they should be performing per period, there are many factors that can influence your Benchmark report.
- The Benchmark Report not only takes into consideration each students’ highest scores, but also the age of the students in months. Thus, each student is compared to other students around their age.
- The report shows how the student is performing during the specific period that has been selected. If you are looking at the Benchmark Report for Period 2, you are looking at how the student is performing compared to other students around their age during the second assessment period.
- Due to the comparison with the national averages and the tercile system, this report is not optimized to show growth but rather to show comparative performance. More specifically, for example, the middle tercile lumps students between the 26th and the 74th percentiles, and so even if a student grew significantly between two periods, if their Benchmark scores still fall within the middle tercile, their Benchmark will still be displayed as Meeting.
Viewing the Benchmarks Report
The Benchmarks Report can be viewed by all user levels. Teachers will have access to the data for the students within their classroom whereas users with higher-level access will have additional data. More specifically, Directors will be able to view the data for all of the classrooms within their center and Administrators will be able to view the data for all of the centers and the classrooms within their organization.
Teachers
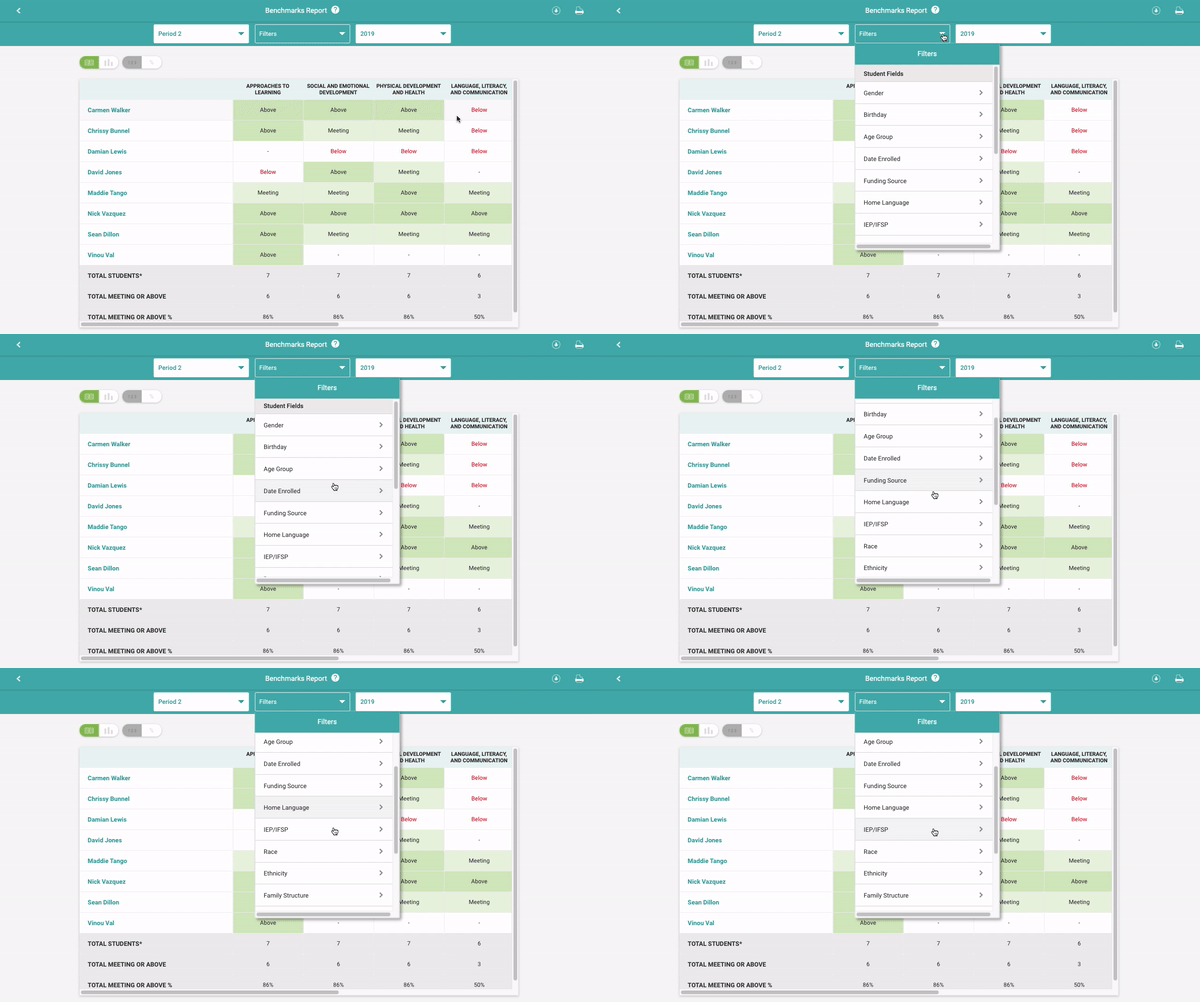
Teachers have a few options on how they view the Report. When first opening the Benchmarks Report, they will see all students on the left-hand side with the categories along the top of the chart. As in other reports, teachers can use the filters to look at specific subsets of data. Teachers can also click on a specific student’s name to look at the individual student data for each of the 8 COR Advantage items. Additionally, Teachers can also choose to view their classroom data in a bar graph. The bar graph shows how many students have averaged below, meeting, or above for each of the 8 categories.

Administrators
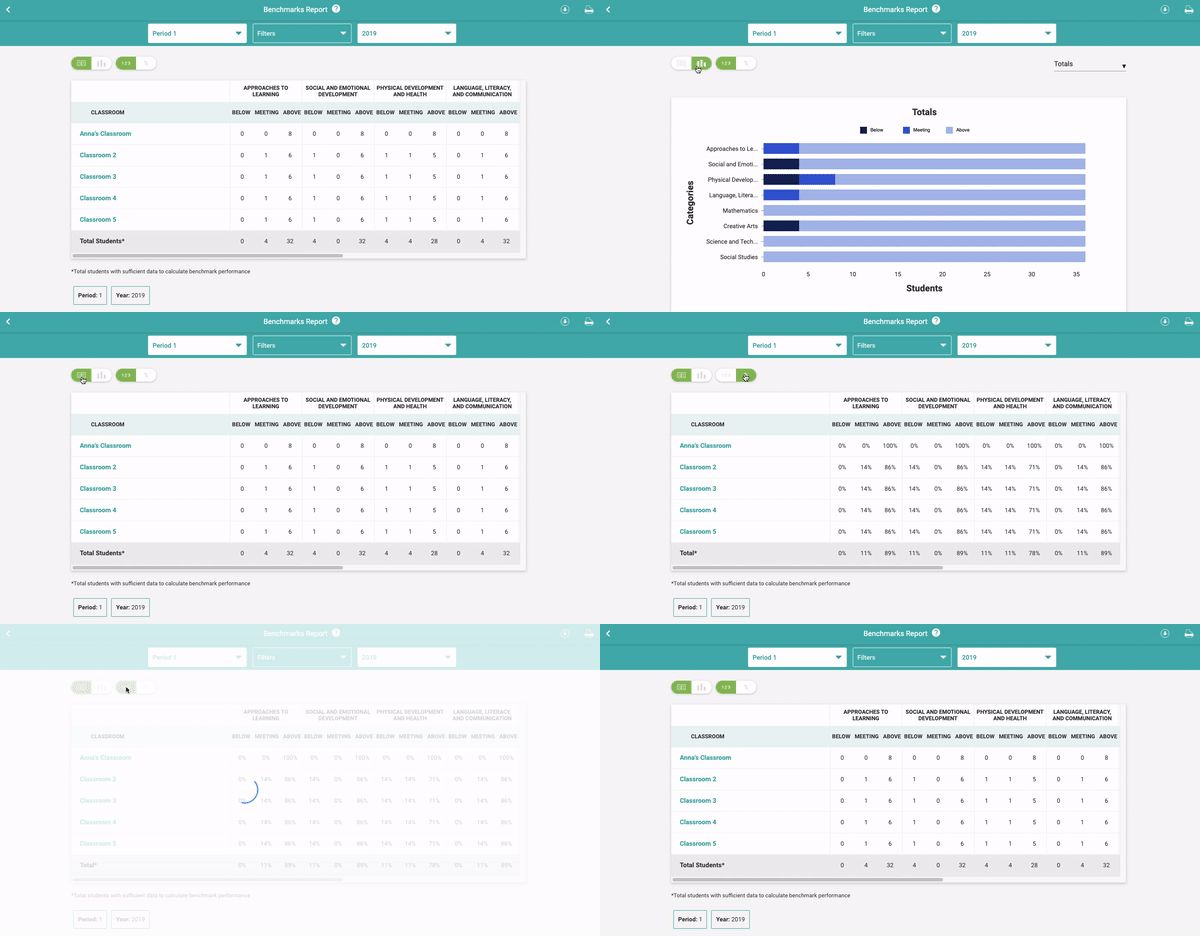
Administrators can access the Benchmarks Report at the classroom, center, and organization levels. From the center and organization levels, Administrators will see the total number of students that are below, meeting, or above the average. Administrators can view the Benchmark data through the chart or in a graph and they can also select to view the data as totals or as a percentage by using the toggles below the filters.

Comments
0 comments
Please sign in to leave a comment.