
Overview of Tags Report
The Tags Report enables teachers and administrators to compile data on the tags in their accounts. This is a powerful tool to analyze the usage of tags. This option will allow you to filter your account’s data by specific learning standards or tags, students, and the date range. You have the option to view the Number of Tags, Average Rating, and Max Rating. You can learn more about Tags in the Tags Overview article.
Table of Contents
Accessing Tags Report
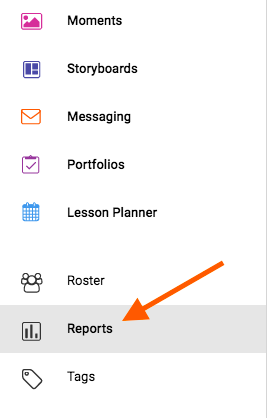
You can access the Tags Report from the Kaymbu or COR Advantage app on your device or from the website my.kaymbu.com by going to Menu > Reports > Tags. After selecting Reports, users with the COR Advantage assessment will select Growth & Planning and then select Tags.
Please note, access to Reports from a mobile device is dependent on the size and orientation of your screen. Your device must have at least 768 pixels and may need to be in landscape mode in order to access the report.
Create a Tag Report
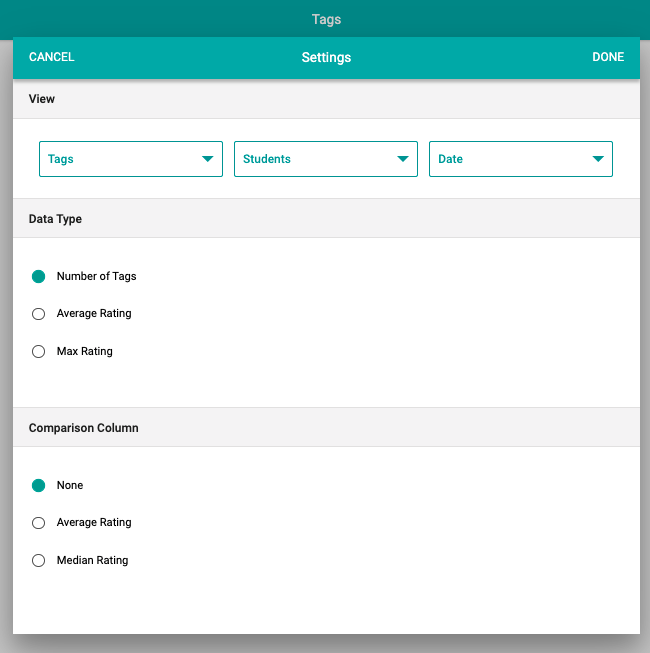
Tags Report allows teachers and administrators to keep track of tagged observations. To create a new Tags Report, simply click on the gear icon on the top right to define what you want to see in the report. If it's your first time creating a Tags Report, you can also click the green "Settings" button in the middle.
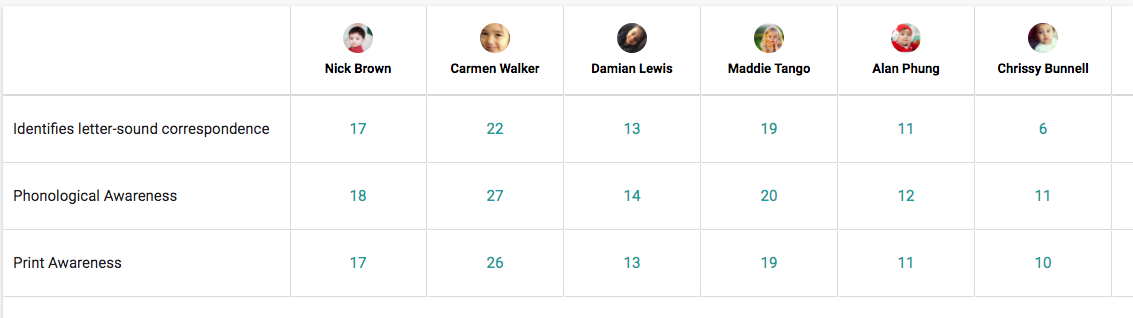
- Number of Tags will tell you the number of observations that's been assigned for each tag. This can be helpful to keep track of what kind of activities you have already done and what you want to do more of.
- Average Rating to show you the average of all of the selected students' scores
- Max Rating to show you the highest score each student scored on each item
You can also create a comparison column if, for instance, you wanted to compare how each student scored compared to the average of the class.
Technical Tutorial for Tags Report
You can find a short video that provides an overview of navigating the Tags Report below:
Comments
0 comments
Please sign in to leave a comment.