Overview of the Growth Report
The Growth Report enables users to easily, and visually, track student growth over time for each category. When multiple students are selected, the Growth Report shows the average of the highest score observed for the selected students in the assessment period. If a single student is selected, the values represent the highest score observed for the student for each assessment period. As an administrator, this report can quickly view and compare the averages of the highest scores across multiple classrooms across periods. For example, you can identify the scores your classrooms started with during Period 1 and identity which classrooms made the most growth to ensure resources and support are being leveraged as needed. From a teacher's perspective, the Growth Report shows each student's scores over time while also showing the class average. This makes it easy to spot trends in student growth and see where individual students fall.
Table of Contents
Accessing Growth Report
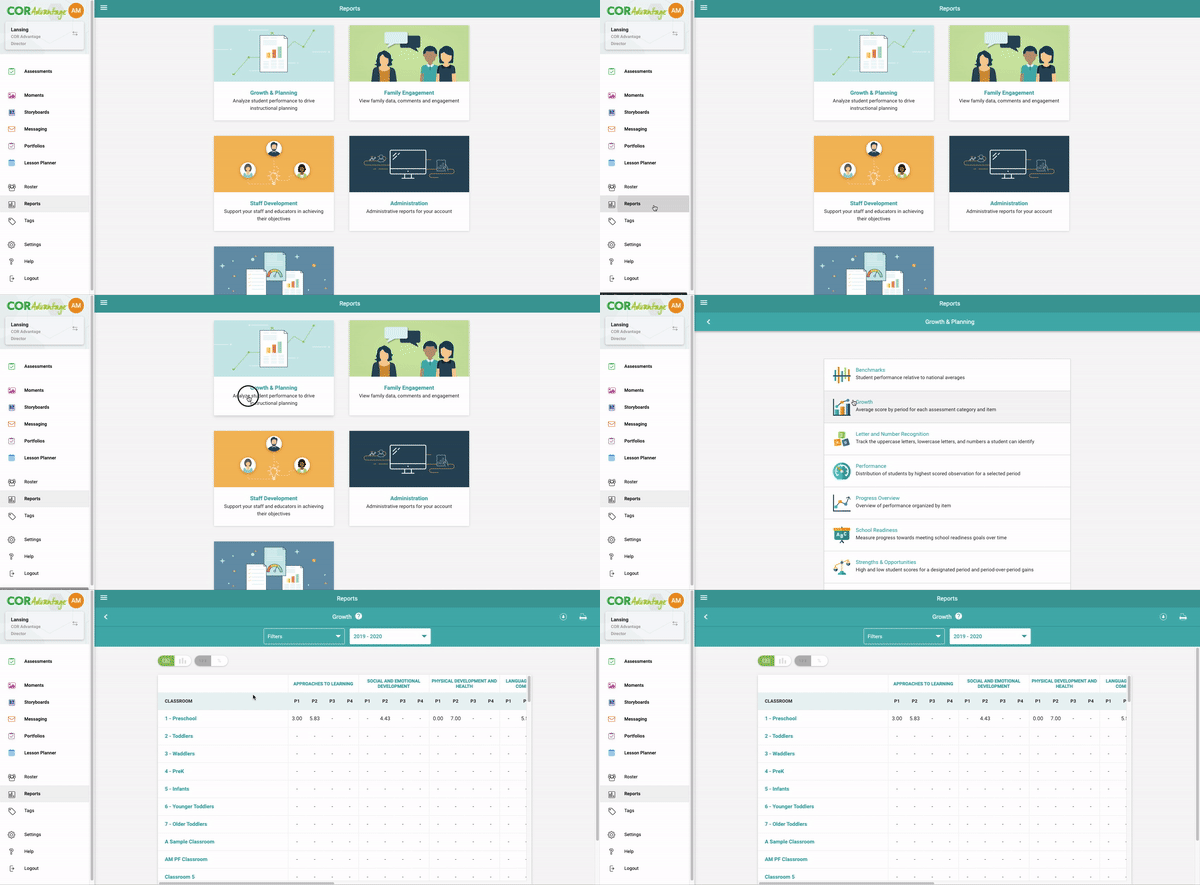
The Growth Report is accessible for users with the COR Advantage assessment from the website my.kaymbu.com by going to Menu > Reports > Growth and Planning > Growth. Please note, access to this from a device is dependent on the size and orientation of your screen. Your device must have at least 768 pixels and may need to be in landscape mode in order to access the report.

Viewing Growth Report
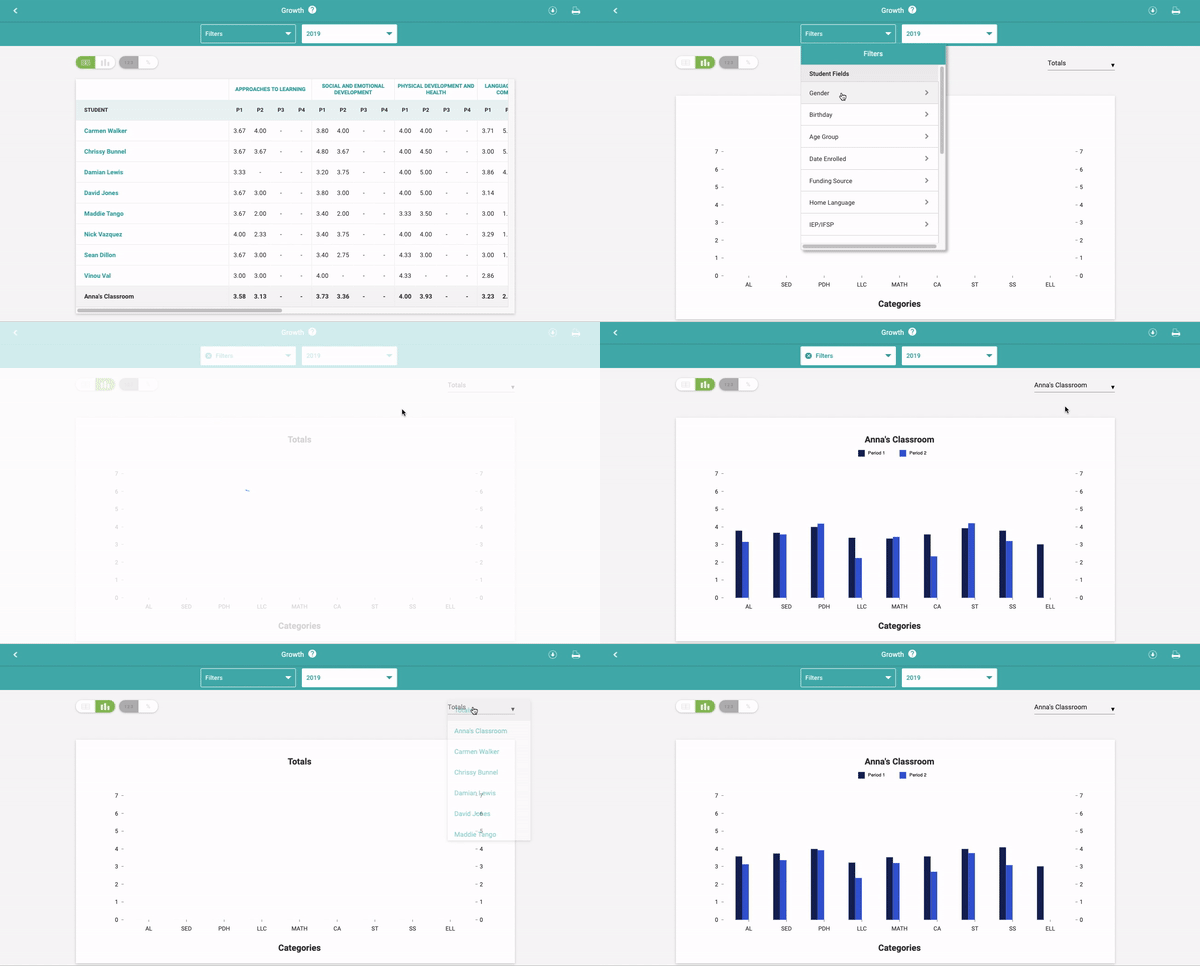
By default, you will see the data for all students you have access to within your account. Along the left-hand side, Teachers will see their students and administrators will see the different entities they have access to - classrooms, centers, and/or organizations.

As an administrator, you can also click on an entity to see a more specific view. For example, you can click on a center to see the classrooms within the center, or into a classroom to see the students in the classroom. You can even click on an individual student to see their individual scores. If a single student is selected, the values represent the highest score observed for the student for each assessment period.

To look at a subset of students, you can use the filters on the top of the page to view data based on the demographic fields attached to your student profiles. It is possible to select whichever combination of demographic filters you would like. Additionally, scores can be represented as a graph by navigating between the view options.

In the top right corner of this report are the download and print icons. You can select either of those to export the information currently displayed on the screen.
Comments
0 comments
Please sign in to leave a comment.