When would I use the School Readiness Report?
The School Readiness Report measures student progress towards meeting school readiness goals over time. The School Readiness Report measures readiness to enter Kindergarten based on an overall score of a 4 on the COR Advantage assessment. A program may take other criteria into consideration when evaluating a child's readiness to enter kindergarten, such as additional assessment measures, including the age of the child or any other formal or informal measurements and anecdotal evidence, to determine which kindergarten placement is the best fit.
Table of Contents
Accessing School Readiness Report
The School Readiness Report is accessible for users with the COR Advantage assessment from the website my.kaymbu.com by going to Menu > Reports > Growth and Planning > School Readiness. Please note, access to this from a device is dependent on the size and orientation of your screen. Your device must have at least 768 pixels and may need to be in landscape mode in order to access the report.

Calculations of School Readiness
Children are determined to be school-ready if they have an average score of 3.75 in each category and an overall average of 4.0 or higher. In order to evaluate, a student must have at least 75% of the assessment items completed and scored per category for all 8 categories. For students with less than 75% completion per category, there is insufficient data to determine school readiness. These guidelines were set by the research team at HighScope as they looked at state and Common Core standards for Kindergarten.
Viewing School Readiness Report
By default, you will be able to see all students your role gives you access to. Teachers will see the students in their classroom, while administrators can see all students in their organization(s) or center(s). Through the filter at the top of the page, you can select student fields or data sets filters to look at further subsets of data.
Teachers
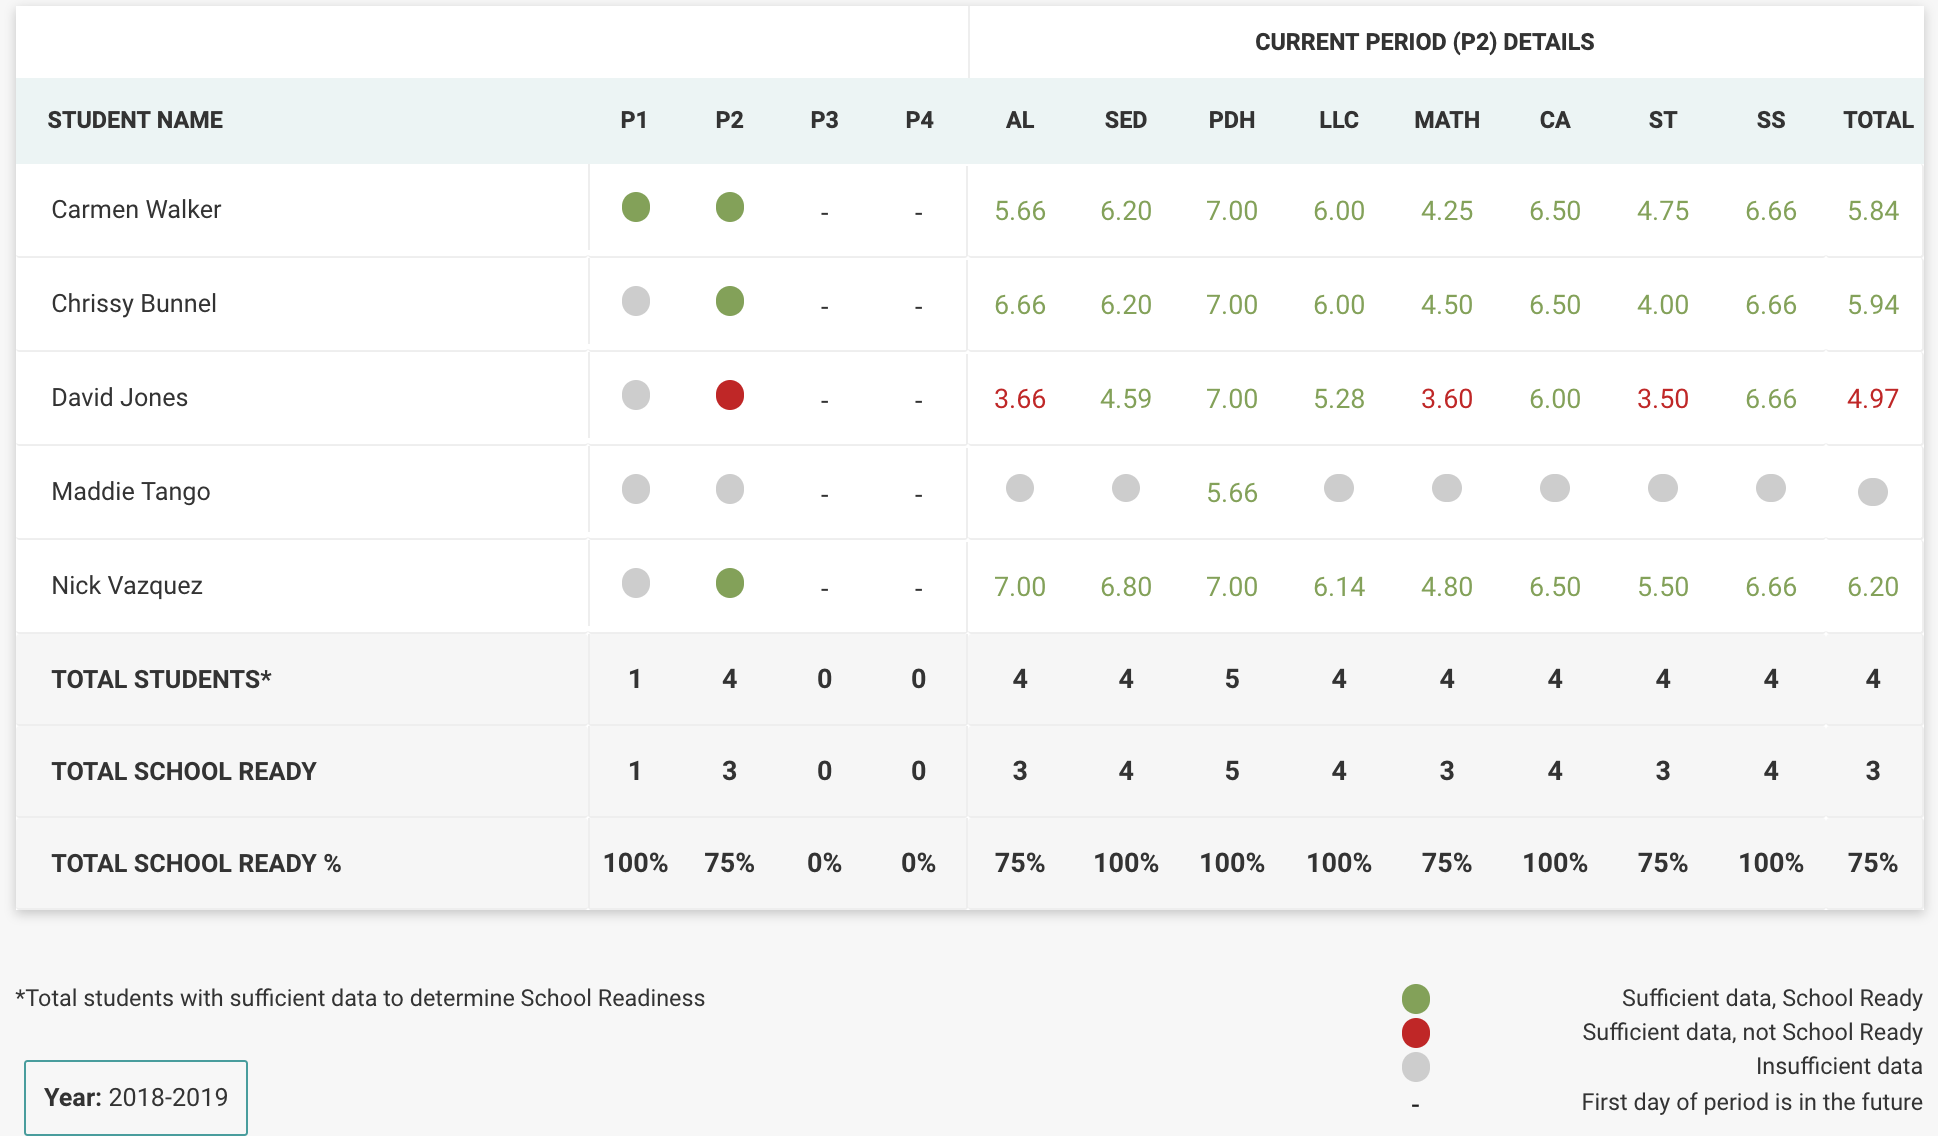
In the classroom view of the School Readiness Report, there are two sections. The first section shows the school readiness status for each period. The red circle indicates a student is not school-ready, i.e. they do not have an average score of 3.75 in each category and an overall average of 4.0 or higher. The green circle indicates a student is school-ready, while the gray circle shows there is insufficient data to determine school readiness. On the right, the second section shows the average of the highest scores from the current period. Again, a gray circle indicates there is insufficient data - in this case, less than 75% completion for a category - to determine school readiness.
Administrators
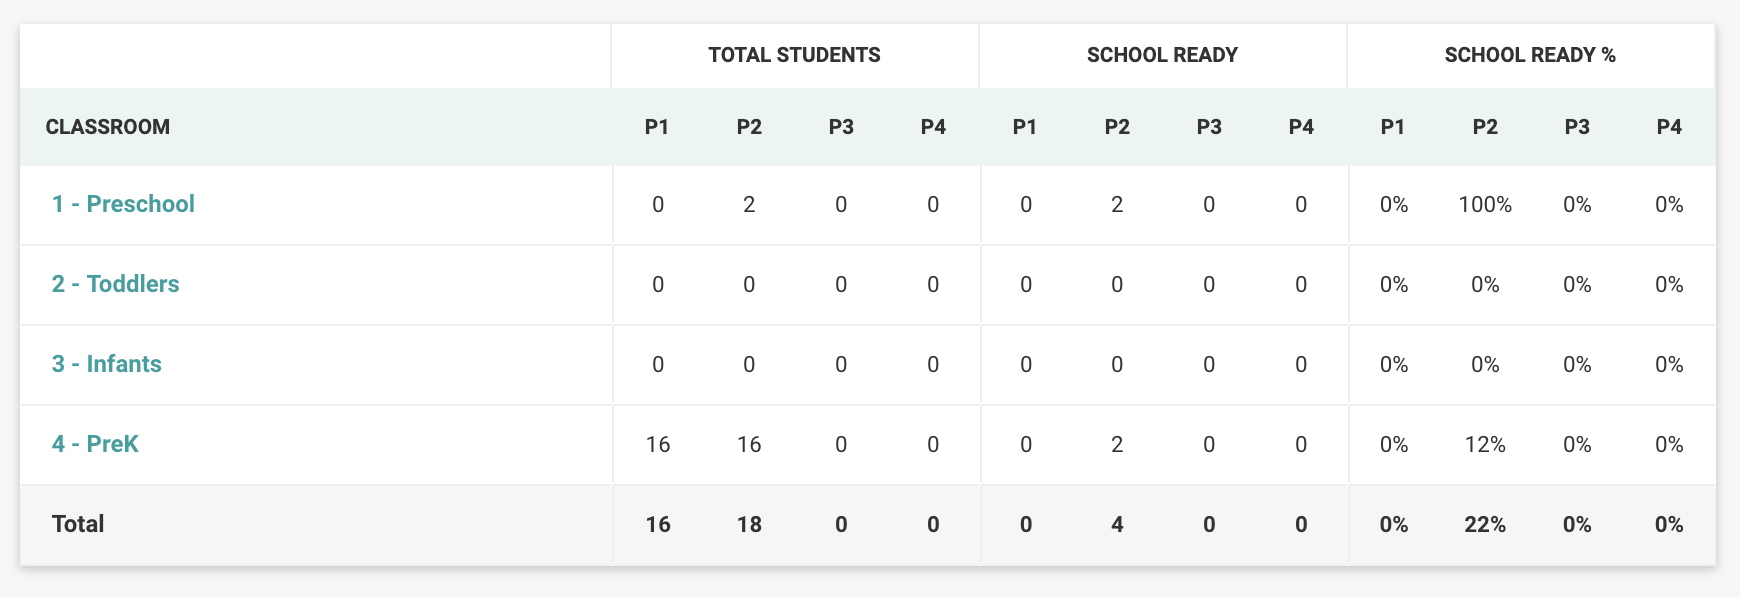
Administrators can access the School Readiness Report at the classroom, center, and organization level. At these levels, the School Readiness Report will have three columns to show the total number of students, the number of students that are school-ready, and the percentage of students that are school ready. While the report will show all students, it's important to keep in mind that you would not expect Infants or Toddlers to be ready for Kindergarten so you can use the filters at the top to look at students whose ages or birthdates fall in the appropriate age group.
The number of students in the Total Students section represents only students who have sufficient data to be evaluated (at least 75% of the assessment items scored in each category). Similarly, the Percentage column calculates the percentage of students that are school-ready out of the total number of students who are eligible to be evaluated.
Comments
0 comments
Please sign in to leave a comment.