Overview of Progress Overview Report
Through the Progress Overview Report, you can track student progress across periods for specific COR Advantage items. As an administrator, you can use the “Students” filter, to look at the scores for a specific group of classrooms and see how those classrooms started with certain items and how they are progressing. As a teacher, you may want to look at specific students across periods. Navigate to the "Students" filter, select an individual student and once you click off the filter, the data will reload showing the scores of that individual child. The Progress Overview Report shows the average of the highest scores for each COR category and item for the selected students by each assessment period.
Table of Contents
Accessing Progress Overview Report
The Progress Overview Report is accessible for users with the COR Advantage assessment from the website my.kaymbu.com by going to Menu > Reports > Growth and Planning > Progress Overview. Please note, access to this from a device is dependent on the size and orientation of your screen. Your device must have at least 768 pixels and may need to be in landscape mode in order to access the report.
Viewing Progress Overview
The Progress Overview Report shows the average of the highest scores for each COR category and item for the selected students by each assessment period. By default, you will be able to see all students your role gives you access to. Teachers will see the students in their classroom, while administrators can see all students in their organization(s) or center(s).
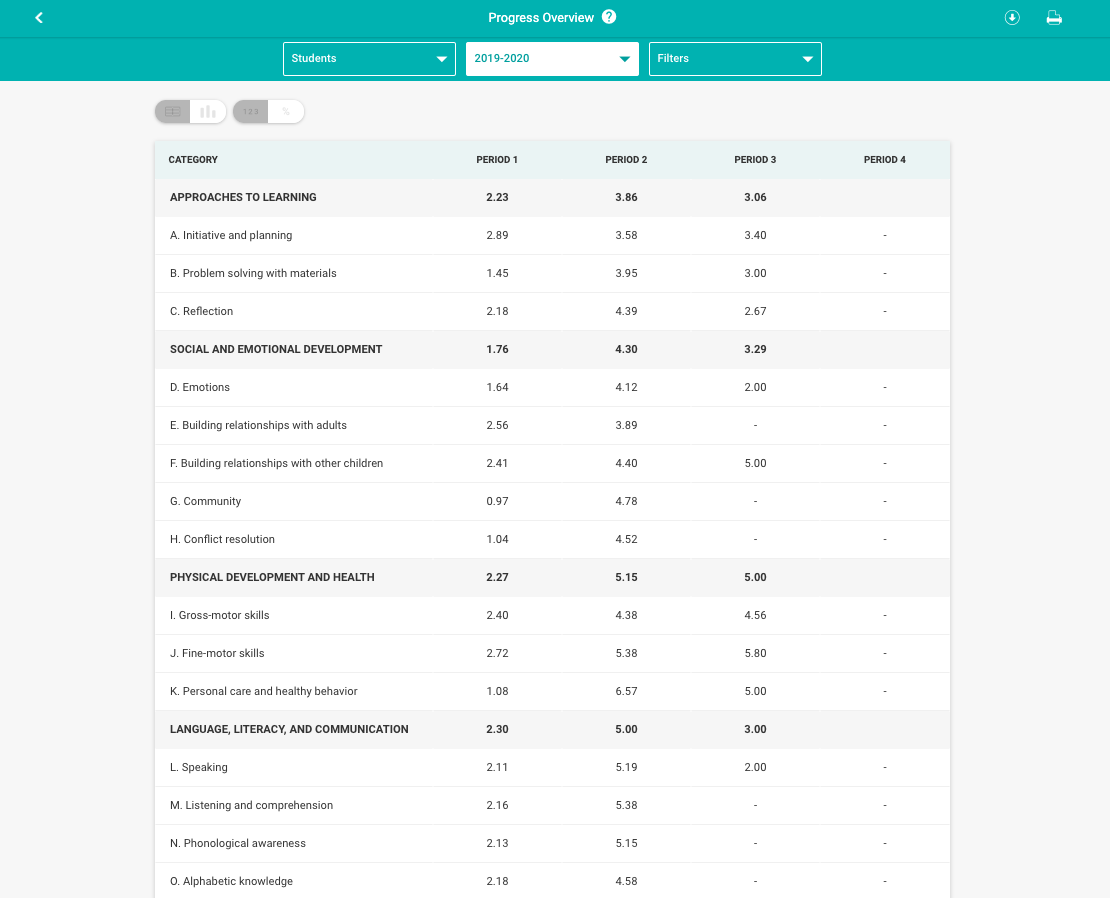
- Students: You have the ability to select a specific group of students, whether it be an organization, center, or classroom, click the box to the left of the entity name. If you click on the arrow to the right of the entity name, you will be able to make a selection from the next level, all the way to the classroom level. If a single student is selected, the values represent the highest score observed for the student for each assessment period.
- Year: The Year filter allows you to see your data from previous school years. Select the drop-down and toggle between the years to change your data.
- Filters: In addition to viewing data for specific students or groups of students, you can choose to filter the data based on the demographic fields attached to your student profiles. Like viewing for students, it is possible to select whichever combination of demographic filters you would like. You can also choose to view the data with Matched Data Sets.
All filters applied will be displayed at the bottom of the report.
In the top right corner of this report, you will see download and print icons. You can select either of those to export the information currently displayed on the screen.
Comments
0 comments
Please sign in to leave a comment.