Overview of Student Completion Report
The Student Completion report shows the percentage of assessment items observed for individual students for each assessment period, regardless of which classroom or teacher observed the child. This is primarily used as a holistic view of how students have been assessed over time.
Table of Contents
- Accessing Student Completion Report
- Calculating Student Completion
- Viewing Student Completion Report
Accessing Student Completion Report
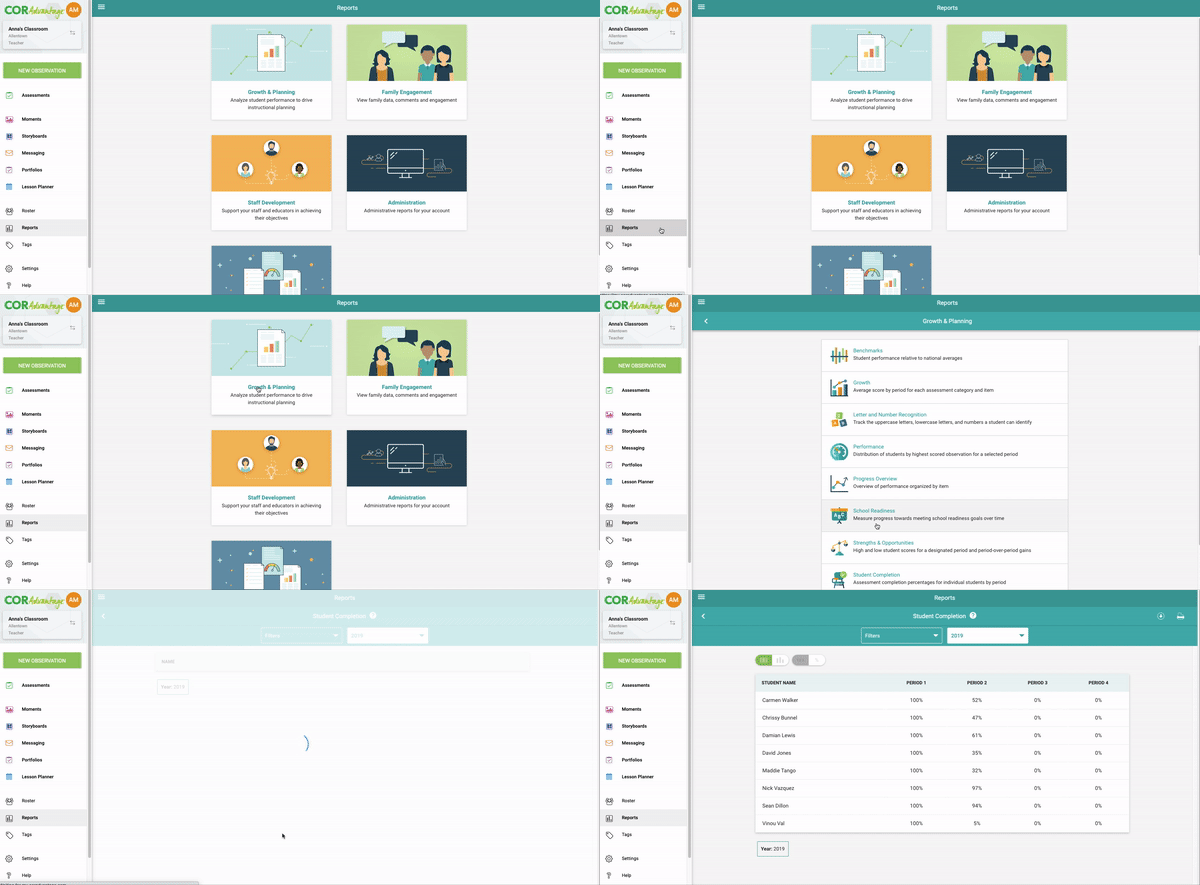
The Student Completion Report is accessible for users with the COR Advantage assessment from the website my.kaymbu.com by going to Menu > Reports > Growth and Planning > Student Completion. Please note, access to this from a device is dependent on the size and orientation of your screen. Your device must have at least 768 pixels and may need to be in landscape mode in order to access the report.

Calculating Student Completion
Student completion is calculated based on completed observations for each item within a period. A complete observation includes student(s), COR Advantage items, or tag(s), and each tag has been scored on a rating scale of 0-7. Once each student has at least one scored observation for each item in each of the 8 categories, that student will reach 100% completion.
Viewing Student Completion Report
By default, you will see the data for all students you have access to within your account. Along the left-hand side, Teachers will see their students and administrators will see the different entities they have access to - classrooms, centers, and/or organizations.
The Student Completion Report displays the completion data based on scored observations for the active students on a particular roster. If a student joins the school year after one or more of the periods has already ended, the student will display 0% for those previous periods. Please note, this is different than the Classroom Completion Report. In the Classroom Completion Report, once an assessment period has been locked, a snapshot of the completion percentage is taken at that time. Once the snapshot has been taken, the data in the Classroom Completion Report will not change in the future if students are added or removed.
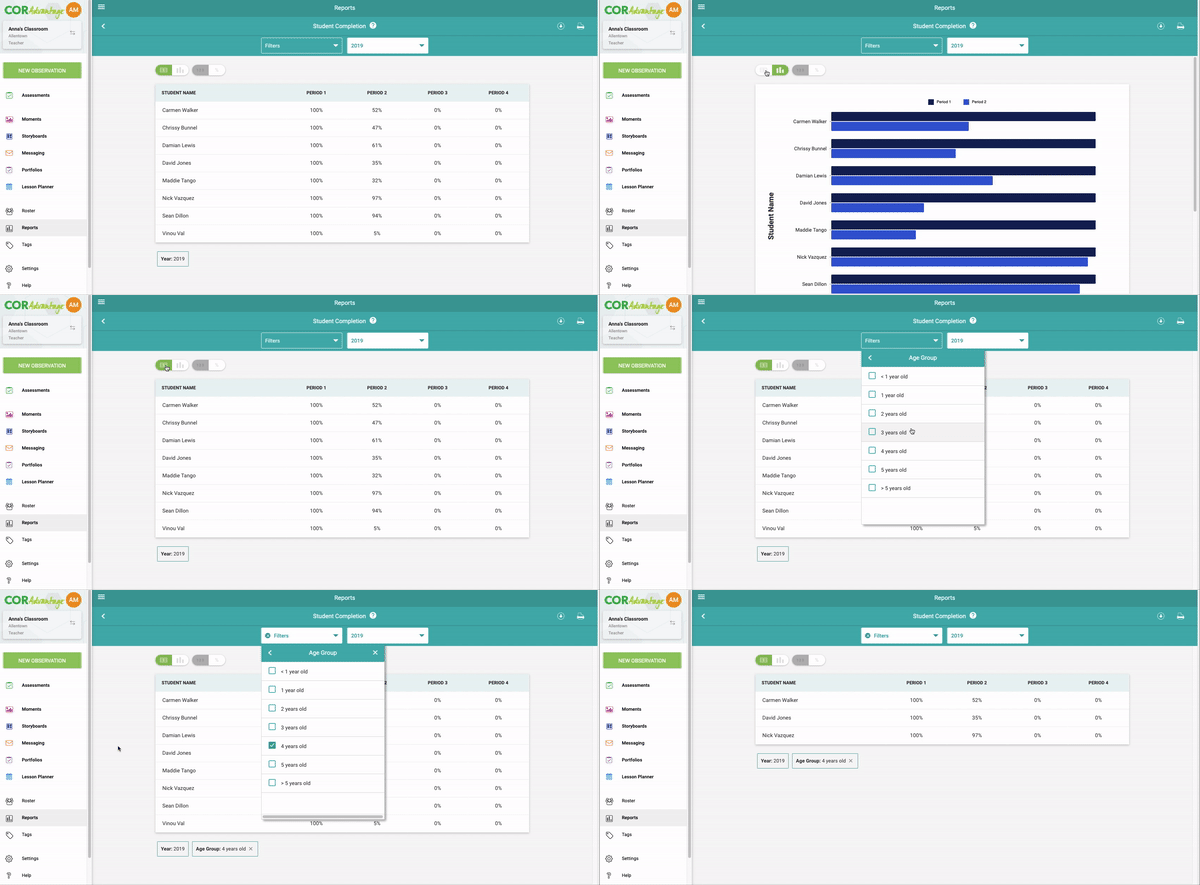
The data of the Student Completion Report can be viewed in the default table view or can also be viewed as a bar graph. You can choose to sort the data by various student fields in the filter option. Finally, in the top right corner are the download and print icons. You can select either of those to export the information currently displayed on the screen.

Comments
0 comments
Please sign in to leave a comment.